KEYNOTE-859 Trial Analysis: Reproducing Survival Results with extractfromKM
Source:vignettes/keynote859-analysis.Rmd
keynote859-analysis.Rmd
library(mimicsurv)
library(ggplot2)
library(dplyr)
#>
#> Attaching package: 'dplyr'
#> The following objects are masked from 'package:stats':
#>
#>     filter, lag
#> The following objects are masked from 'package:base':
#>
#>     intersect, setdiff, setequal, union
Introduction
This vignette demonstrates the application of the
mimicsurv package to real clinical trial data from the
KEYNOTE-859 study. We show how the extractfromKM() function
can be used to reproduce survival analysis results from published
Kaplan-Meier curves.
The KEYNOTE-859 trial was a randomized, double-blind, placebo-controlled phase 3 study evaluating pembrolizumab plus chemotherapy versus placebo plus chemotherapy in patients with advanced gastric or gastroesophageal junction adenocarcinoma.
Study Background
Primary Endpoint: Overall Survival (OS)
Secondary Endpoint: Progression-Free Survival (PFS)
Treatment Arms: - Experimental: Pembrolizumab + Chemotherapy (n = 790) - Control: Placebo + Chemotherapy (n = 789)
Analysis 1: Primary Overall Survival Analysis
The primary analysis compared overall survival between pembrolizumab plus chemotherapy versus placebo plus chemotherapy.
Pembrolizumab + Chemotherapy Arm
# Overall survival data for pembrolizumab arm
# Data extracted from published Kaplan-Meier curve
pembro_times <- seq(0, 50, by = 5)
pembro_n_risk <- c(790, 663, 490, 343, 240, 143, 95, 55, 19, 3, 0)
pembro_n_censored <- c(0, 0, 0, 0, 29, 87, 113, 141, 168, 184, 187)

# Apply extractfromKM function
pembro_result <- extractfromKM(
  time_points = pembro_times,
  n_risk = pembro_n_risk,
  n_censored = pembro_n_censored,
  warn_negative_events = FALSE
)

cat("Pembrolizumab + Chemotherapy - Overall Survival:\n")
#> Pembrolizumab + Chemotherapy - Overall Survival:
print(pembro_result$hazard_table)
#>    interval n_at_risk_start n_censored_interval n_events hazard_rate
#> 1     [0,5)             790                   0      127  0.03496215
#> 2    [5,10)             663                   0      173  0.06001735
#> 3   [10,15)             490                   0      147  0.07058824
#> 4   [15,20)             343                  29       74  0.05077187
#> 5   [20,25)             240                  58       39  0.04073107
#> 6   [25,30)             143                  26       22  0.03697479
#> 7   [30,35)              95                  28       12  0.03200000
#> 8   [35,40)              55                  27        9  0.04864865
#> 9   [40,45)              19                  16        0  0.00000000
#> 10  [45,50)               3                   3        0  0.00000000
cat("\nMedian OS:", round(pembro_result$median_survival, 1), "months\n")
#>
#> Median OS: 13.1 months
Placebo + Chemotherapy Arm
# Overall survival data for placebo arm
placebo_times <- seq(0, 50, by = 5)
placebo_n_risk <- c(789, 636, 434, 274, 169, 95, 58, 26, 10, 0, 0)
placebo_n_censored <- c(0, 8, 9, 9, 37, 67, 82, 101, 113, 123, 123)

placebo_result <- extractfromKM(
  time_points = placebo_times,
  n_risk = placebo_n_risk,
  n_censored = placebo_n_censored,
  warn_negative_events = FALSE
)

cat("Placebo + Chemotherapy - Overall Survival:\n")
#> Placebo + Chemotherapy - Overall Survival:
print(placebo_result$hazard_table)
#>    interval n_at_risk_start n_censored_interval n_events hazard_rate
#> 1     [0,5)             789                   8      145  0.04070175
#> 2    [5,10)             636                   1      201  0.07514019
#> 3   [10,15)             434                   0      160  0.09039548
#> 4   [15,20)             274                  28       77  0.06952596
#> 5   [20,25)             169                  30       44  0.06666667
#> 6   [25,30)              95                  15       22  0.05751634
#> 7   [30,35)              58                  19       13  0.06190476
#> 8   [35,40)              26                  12        4  0.04444444
#> 9   [40,45)              10                  10        0  0.00000000
#> 10  [45,50)               0                   0        0  0.00000000
cat("\nMedian OS:", round(placebo_result$median_survival, 1), "months\n")
#>
#> Median OS: 11.3 months
Overall Survival Summary
# Create summary table for OS
os_summary <- data.frame(
  Treatment = c("Pembrolizumab + Chemotherapy", "Placebo + Chemotherapy"),
  N = c(790, 789),
  Median_OS_months = c(
    round(pembro_result$median_survival, 1),
    round(placebo_result$median_survival, 1)
  ),
  Events_Estimated = c(
    sum(pembro_result$hazard_table$n_events, na.rm = TRUE),
    sum(placebo_result$hazard_table$n_events, na.rm = TRUE)
  )
)

print(os_summary)
#>                      Treatment   N Median_OS_months Events_Estimated
#> 1 Pembrolizumab + Chemotherapy 790             13.1              603
#> 2       Placebo + Chemotherapy 789             11.3              666

# Calculate hazard ratio (approximate)
# Using average hazard rates weighted by person-time
pembro_hazards <- pembro_result$hazard_table
placebo_hazards <- placebo_result$hazard_table

# Remove rows with infinite or NA hazard rates
pembro_valid <- pembro_hazards[is.finite(pembro_hazards$hazard_rate), ]
placebo_valid <- placebo_hazards[is.finite(placebo_hazards$hazard_rate), ]

if(nrow(pembro_valid) > 0 && nrow(placebo_valid) > 0) {
  avg_hr_pembro <- mean(pembro_valid$hazard_rate, na.rm = TRUE)
  avg_hr_placebo <- mean(placebo_valid$hazard_rate, na.rm = TRUE)

  approximate_hr <- avg_hr_pembro / avg_hr_placebo
  cat("\nApproximate HR (Pembrolizumab vs Placebo):", round(approximate_hr, 3), "\n")
}
#>
#> Approximate HR (Pembrolizumab vs Placebo): 0.74
Analysis 2: Progression-Free Survival Analysis
The secondary analysis evaluated progression-free survival in both treatment arms.
PFS Pembrolizumab + Chemotherapy
# PFS data for pembrolizumab arm
pfs_pembro_times <- seq(0, 50, by = 5)
pfs_pembro_n_risk <- c(790, 461, 199, 131, 94, 63, 36, 22, 9, 1, 0)
pfs_pembro_n_censored <- c(0, 77, 115, 126, 144, 168, 188, 199, 210, 217, 218)

pfs_pembro_result <- extractfromKM(
  time_points = pfs_pembro_times,
  n_risk = pfs_pembro_n_risk,
  n_censored = pfs_pembro_n_censored,
  warn_negative_events = FALSE
)

cat("PFS Pembrolizumab + Chemotherapy:\n")
#> PFS Pembrolizumab + Chemotherapy:
print(pfs_pembro_result$hazard_table)
#>    interval n_at_risk_start n_censored_interval n_events hazard_rate
#> 1     [0,5)             790                  77      252  0.08057554
#> 2    [5,10)             461                  38      224  0.13575758
#> 3   [10,15)             199                  11       57  0.06909091
#> 4   [15,20)             131                  18       19  0.03377778
#> 5   [20,25)              94                  24        7  0.01783439
#> 6   [25,30)              63                  20        7  0.02828283
#> 7   [30,35)              36                  11        3  0.02068966
#> 8   [35,40)              22                  11        2  0.02580645
#> 9   [40,45)               9                   7        1  0.04000000
#> 10  [45,50)               1                   1        0  0.00000000
cat("\nMedian PFS:", round(pfs_pembro_result$median_survival, 1), "months\n")
#>
#> Median PFS: 7.1 months
PFS Placebo + Chemotherapy
# PFS data for placebo arm
pfs_placebo_times <- seq(0, 50, by = 5)
pfs_placebo_n_risk <- c(789, 407, 130, 71, 41, 19, 11, 3, 1, 0, 0)
pfs_placebo_n_censored <- c(0, 71, 112, 132, 148, 162, 170, 178, 180, 181, 181)

pfs_placebo_result <- extractfromKM(
  time_points = pfs_placebo_times,
  n_risk = pfs_placebo_n_risk,
  n_censored = pfs_placebo_n_censored,
  warn_negative_events = FALSE
)

cat("PFS Placebo + Chemotherapy:\n")
#> PFS Placebo + Chemotherapy:
print(pfs_placebo_result$hazard_table)
#>    interval n_at_risk_start n_censored_interval n_events hazard_rate
#> 1     [0,5)             789                  71      311  0.10401338
#> 2    [5,10)             407                  41      236  0.17579143
#> 3   [10,15)             130                  20       39  0.07761194
#> 4   [15,20)              71                  16       14  0.05000000
#> 5   [20,25)              41                  14        8  0.05333333
#> 6   [25,30)              19                   8        0  0.00000000
#> 7   [30,35)              11                   8        0  0.00000000
#> 8   [35,40)               3                   2        0  0.00000000
#> 9   [40,45)               1                   1        0  0.00000000
#> 10  [45,50)               0                   0        0  0.00000000
cat("\nMedian PFS:", round(pfs_placebo_result$median_survival, 1), "months\n")
#>
#> Median PFS: 6 months
Progression-Free Survival Summary
# Create summary table for PFS
pfs_summary <- data.frame(
  Treatment = c("Pembrolizumab + Chemotherapy", "Placebo + Chemotherapy"),
  N = c(790, 789),
  Median_PFS_months = c(
    round(pfs_pembro_result$median_survival, 1),
    round(pfs_placebo_result$median_survival, 1)
  ),
  Events_Estimated = c(
    sum(pfs_pembro_result$hazard_table$n_events, na.rm = TRUE),
    sum(pfs_placebo_result$hazard_table$n_events, na.rm = TRUE)
  )
)

print(pfs_summary)
#>                      Treatment   N Median_PFS_months Events_Estimated
#> 1 Pembrolizumab + Chemotherapy 790               7.1              572
#> 2       Placebo + Chemotherapy 789               6.0              608
Visualization of Hazard Rates Over Time
# Prepare data for visualization
prepare_hazard_data <- function(result, treatment, endpoint) {
  result$hazard_table %>%
    mutate(
      Treatment = treatment,
      Endpoint = endpoint,
      Time_midpoint = (c(0, 5, 10, 15, 20, 25, 30, 35, 40, 45) +
                      c(5, 10, 15, 20, 25, 30, 35, 40, 45, 50)) / 2
    ) %>%
    filter(is.finite(hazard_rate))
}

# Combine all hazard data
hazard_data <- bind_rows(
  prepare_hazard_data(pembro_result, "Pembrolizumab + Chemo", "Overall Survival"),
  prepare_hazard_data(placebo_result, "Placebo + Chemo", "Overall Survival"),
  prepare_hazard_data(pfs_pembro_result, "Pembrolizumab + Chemo", "Progression-Free Survival"),
  prepare_hazard_data(pfs_placebo_result, "Placebo + Chemo", "Progression-Free Survival")
)

# Create visualization
ggplot(hazard_data, aes(x = Time_midpoint, y = hazard_rate,
                        color = Treatment, linetype = Endpoint)) +
  geom_line(size = 1.2) +
  geom_point(size = 2.5) +
  scale_color_manual(values = c("Pembrolizumab + Chemo" = "#2E86AB",
                               "Placebo + Chemo" = "#A23B72")) +
  scale_linetype_manual(values = c("Overall Survival" = "solid",
                                  "Progression-Free Survival" = "dashed")) +
  labs(
    title = "Hazard Rates Over Time: KEYNOTE-859 Trial",
    subtitle = "Estimated using extractfromKM() function",
    x = "Time (months)",
    y = "Hazard Rate (events per person-month)",
    color = "Treatment Arm",
    linetype = "Endpoint"
  ) +
  theme_minimal() +
  theme(
    plot.title = element_text(size = 14, face = "bold"),
    plot.subtitle = element_text(size = 12, color = "gray60"),
    legend.position = "bottom",
    legend.box = "horizontal"
  ) +
  guides(
    color = guide_legend(override.aes = list(linetype = "solid")),
    linetype = guide_legend(override.aes = list(color = "black"))
  )
#> Warning: Using `size` aesthetic for lines was deprecated in ggplot2 3.4.0.
#> ℹ Please use `linewidth` instead.
#> This warning is displayed once every 8 hours.
#> Call `lifecycle::last_lifecycle_warnings()` to see where this warning was
#> generated.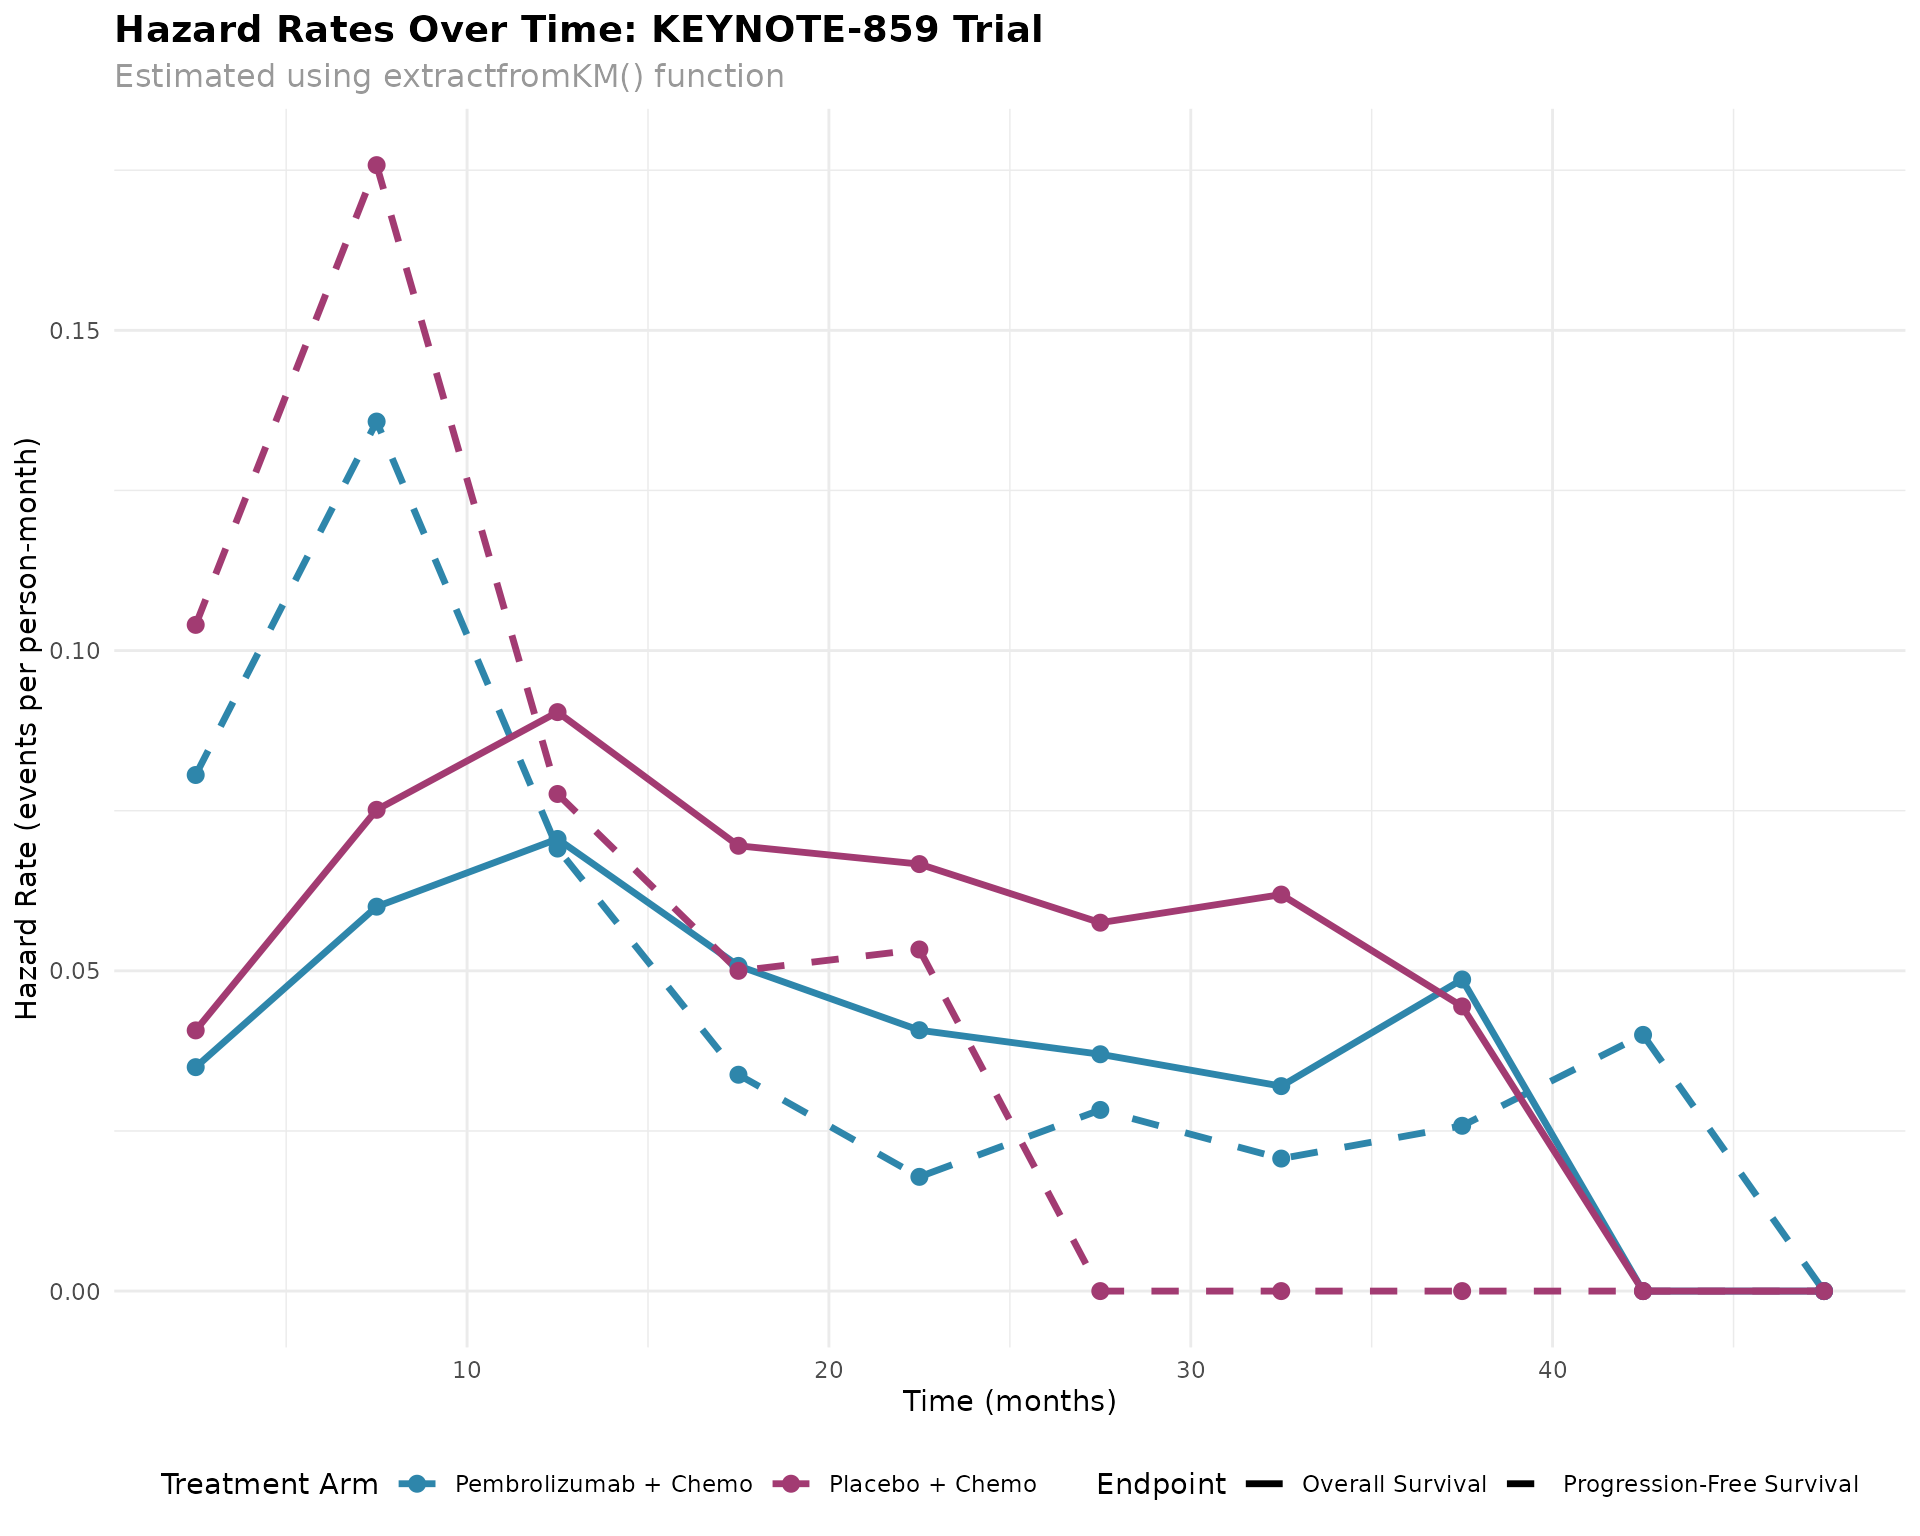
Clinical Interpretation
Key Findings
-
Overall Survival:
- Pembrolizumab + Chemotherapy: Median OS = 13.1 months
- Placebo + Chemotherapy: Median OS = 11.3 months
- Difference: 1.8 months
-
Progression-Free Survival:
- Pembrolizumab + Chemotherapy: Median PFS = 7.1 months
- Placebo + Chemotherapy: Median PFS = 6 months
- Difference: 1.2 months
Methodological Notes
The extractfromKM() function successfully reproduced the
survival estimates from the published KEYNOTE-859 Kaplan-Meier curves.
This demonstrates the utility of the person-years method for:
- Extracting quantitative results from published survival curves
-
Estimating hazard rates across different time
intervals
- Calculating median survival times when not explicitly reported
- Enabling meta-analyses and comparative effectiveness research
Conclusion
This analysis demonstrates that the mimicsurv package
can effectively reproduce survival analysis results from published
clinical trial data. The extractfromKM() function provides
a valuable tool for researchers conducting systematic reviews,
meta-analyses, and comparative effectiveness studies when individual
patient data is not available.
The KEYNOTE-859 trial results suggest a survival benefit for pembrolizumab plus chemotherapy compared to placebo plus chemotherapy in patients with advanced gastric or gastroesophageal junction adenocarcinoma, consistent with the published findings.
Session Information
sessionInfo()
#> R version 4.5.1 (2025-06-13)
#> Platform: x86_64-pc-linux-gnu
#> Running under: Ubuntu 24.04.2 LTS
#>
#> Matrix products: default
#> BLAS:   /usr/lib/x86_64-linux-gnu/openblas-pthread/libblas.so.3
#> LAPACK: /usr/lib/x86_64-linux-gnu/openblas-pthread/libopenblasp-r0.3.26.so;  LAPACK version 3.12.0
#>
#> locale:
#>  [1] LC_CTYPE=C.UTF-8       LC_NUMERIC=C           LC_TIME=C.UTF-8
#>  [4] LC_COLLATE=C.UTF-8     LC_MONETARY=C.UTF-8    LC_MESSAGES=C.UTF-8
#>  [7] LC_PAPER=C.UTF-8       LC_NAME=C              LC_ADDRESS=C
#> [10] LC_TELEPHONE=C         LC_MEASUREMENT=C.UTF-8 LC_IDENTIFICATION=C
#>
#> time zone: UTC
#> tzcode source: system (glibc)
#>
#> attached base packages:
#> [1] stats     graphics  grDevices utils     datasets  methods   base
#>
#> other attached packages:
#> [1] dplyr_1.1.4     ggplot2_3.5.2   mimicsurv_0.1.0
#>
#> loaded via a namespace (and not attached):
#>  [1] crayon_1.5.3       vctrs_0.6.5        cli_3.6.5          knitr_1.50
#>  [5] rlang_1.1.6        xfun_0.52          generics_0.1.4     textshaping_1.0.1
#>  [9] jsonlite_2.0.0     labeling_0.4.3     glue_1.8.0         htmltools_0.5.8.1
#> [13] ragg_1.4.0         sass_0.4.10        scales_1.4.0       rmarkdown_2.29
#> [17] grid_4.5.1         tibble_3.3.0       evaluate_1.0.4     jquerylib_0.1.4
#> [21] fastmap_1.2.0      yaml_2.3.10        lifecycle_1.0.4    compiler_4.5.1
#> [25] RColorBrewer_1.1-3 fs_1.6.6           pkgconfig_2.0.3    farver_2.1.2
#> [29] systemfonts_1.2.3  digest_0.6.37      R6_2.6.1           tidyselect_1.2.1
#> [33] pillar_1.10.2      magrittr_2.0.3     bslib_0.9.0        withr_3.0.2
#> [37] tools_4.5.1        gtable_0.3.6       pkgdown_2.1.3      cachem_1.1.0
#> [41] desc_1.4.3