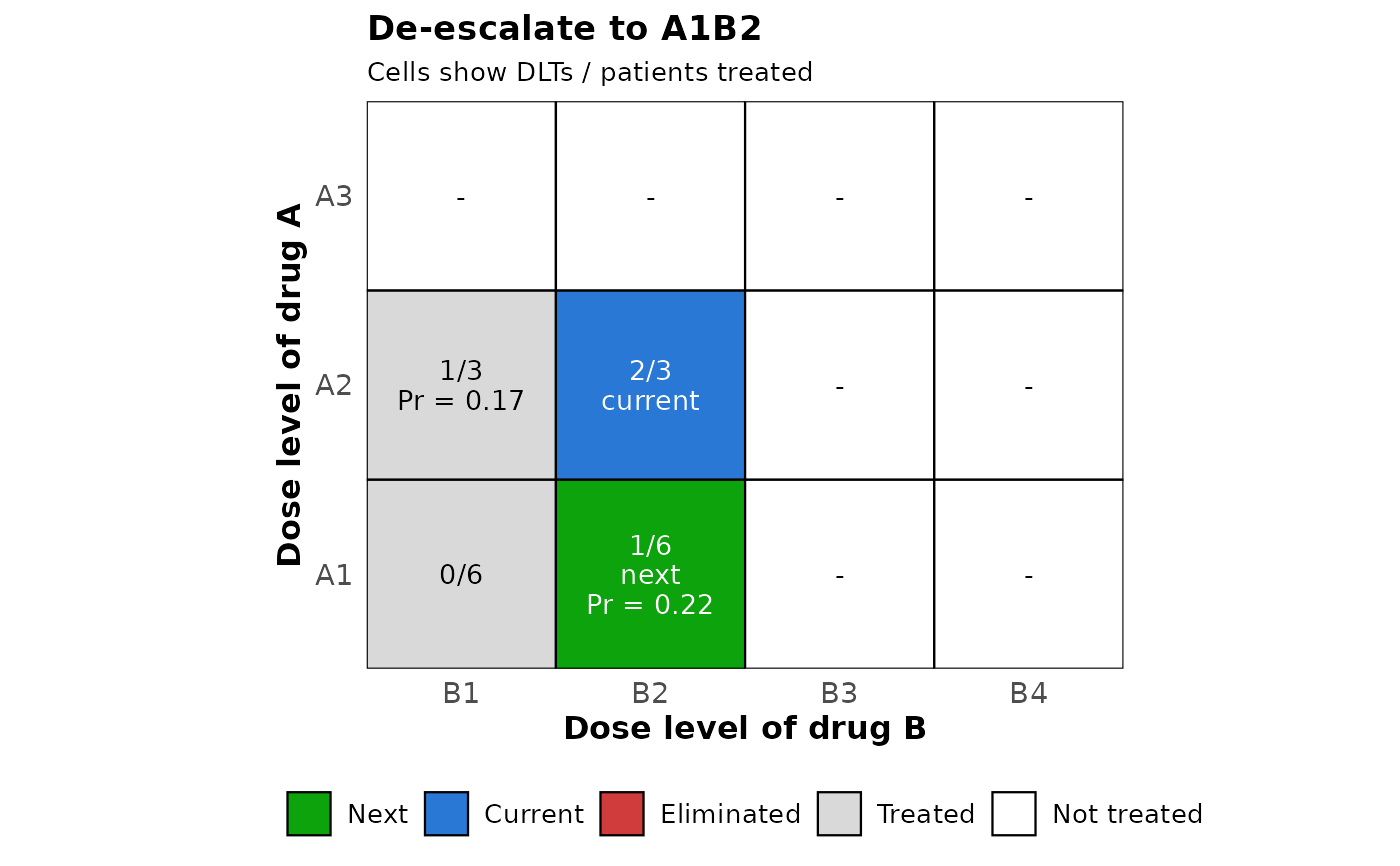
Plot the Next Dose Combination of a BOIN Drug-Combination Trial
Source:R/plot.comb_boin_next.R
plot.comb_boin_next.RdDraw the dose matrix of a drug-combination trial with the data observed at
every combination, the current combination, the combination chosen for the
next cohort and the combinations eliminated, as returned by
comb_boin_next.
Usage
# S3 method for class 'comb_boin_next'
plot(x, text_size = 1, colors = NULL, ...)
Arguments
- x
An object of class
comb_boin_next.- text_size
Numeric scalar. Multiplier applied to every text size in the figure. Use a larger value when the figure is exported at high resolution. Defaults to 1.
- colors
Named character vector of five colors, with names
"Next","Current","Eliminated","Treated"and"Not treated". Defaults to the palette ofplot.boin_decision_table, with gray and white for the combinations that are neither current, next nor eliminated.- ...
Further arguments, currently ignored.
Value
A ggplot2 object, which can be printed, saved with
ggplot2::ggsave() or extended with further layers.
Details
Each cell shows the number of patients with a DLT and the number treated,
and the status of the current, next and eliminated combinations is also
written in the cell, so the figure does not rely on color alone. The
candidates of an escalation or a de-escalation also show the posterior
probability that their DLT rate lies between lambda_e and
lambda_d. The levels of drug A run up the vertical axis and those of
drug B along the horizontal axis.
Requires the ggplot2 package, which is only suggested by simFastBOIN rather than required.