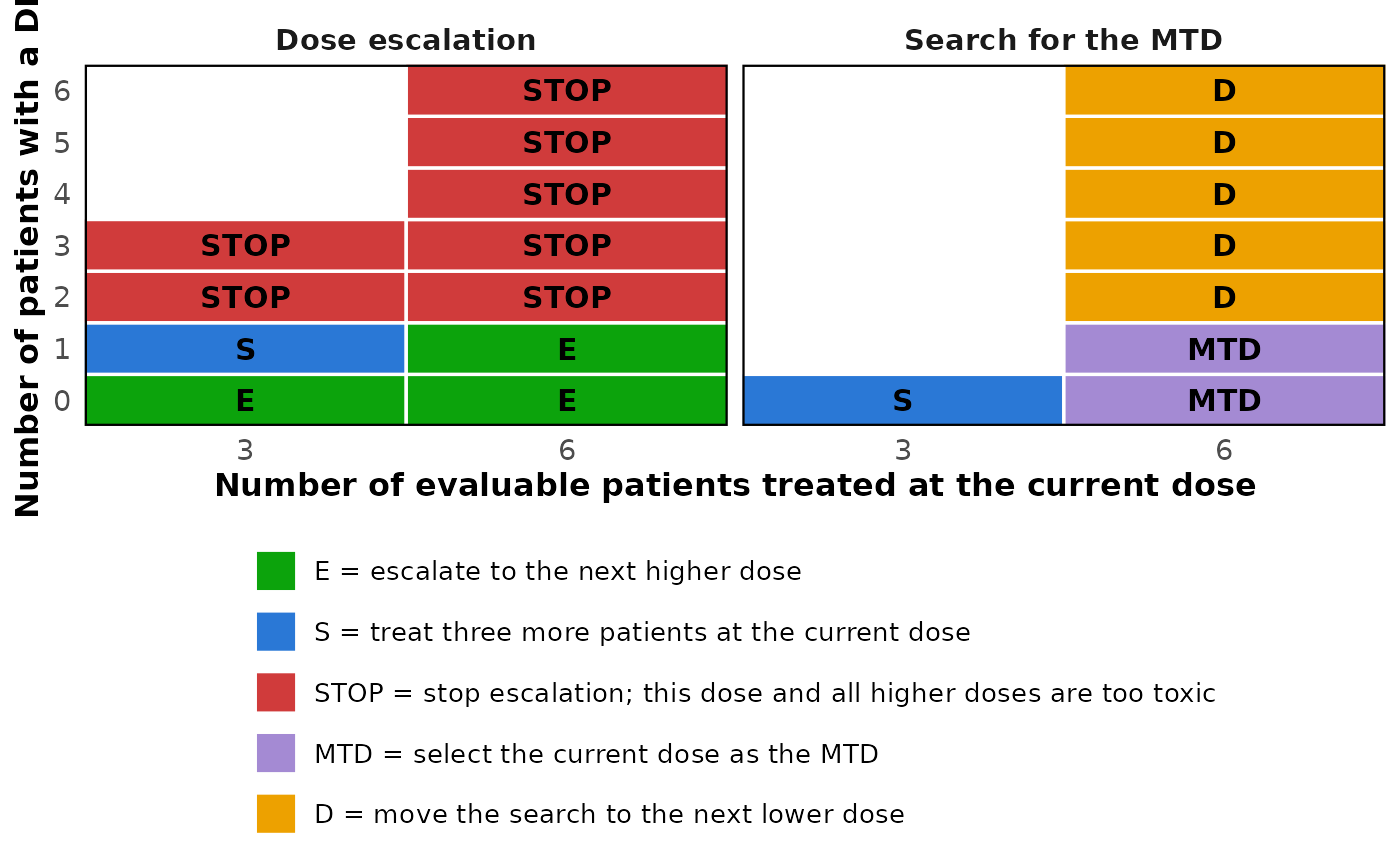
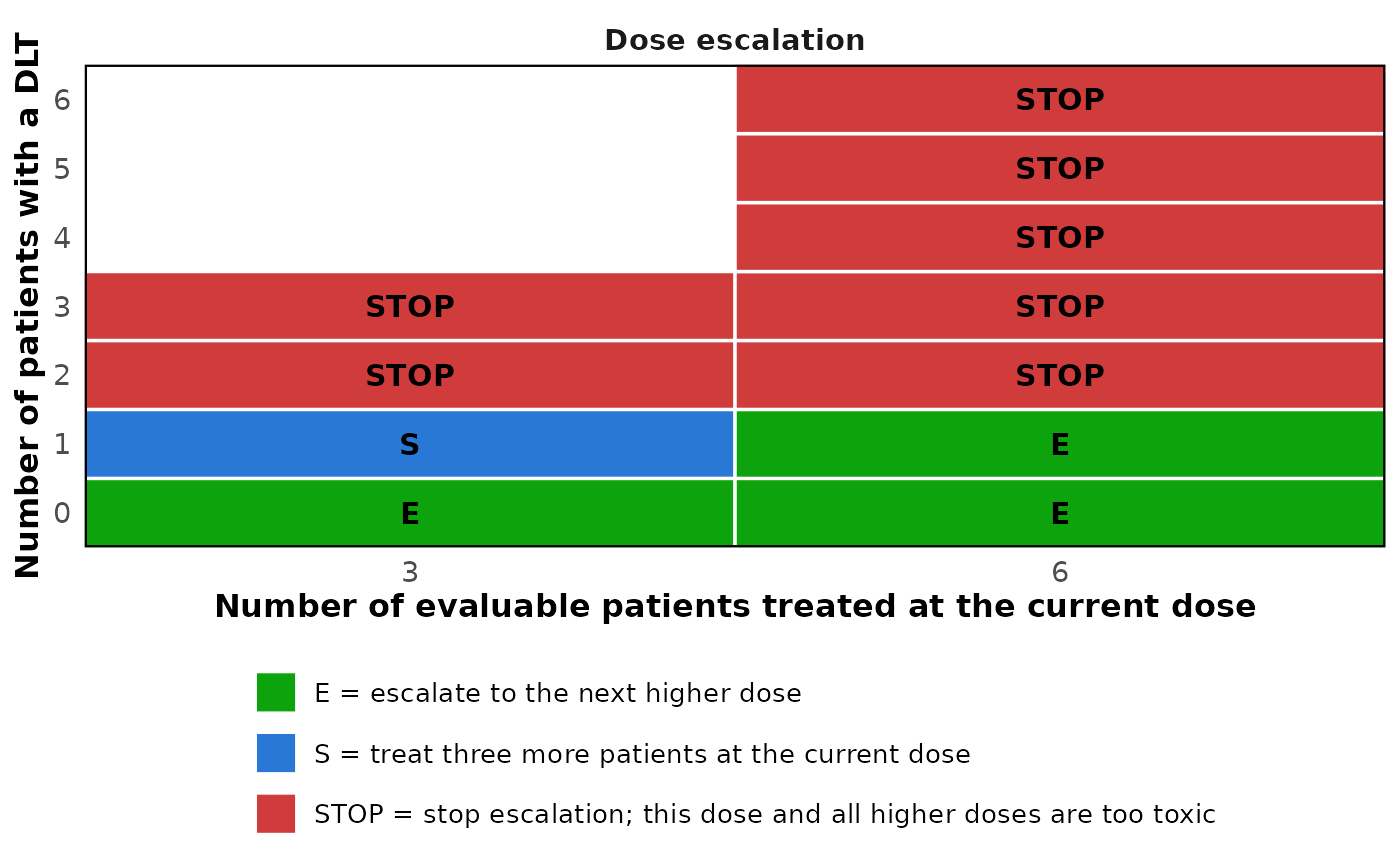
Draw the decision table produced by decision_table_3p3 as a
grid of colored cells, one per pair of patient and DLT counts, with the
decision code in each cell. With mtd_rule = "expand" the search for
the MTD is drawn in a second panel.
Usage
# S3 method for class 'decision_table_3p3'
plot(x, text_size = 1, colors = NULL, ...)
Arguments
- x
An object of class
decision_table_3p3.- text_size
Numeric scalar. Multiplier applied to every text size in the figure. Defaults to 1.
- colors
Named character vector of colors with the names
"E","S"and"STOP", and also"MTD"and"D"formtd_rule = "expand". Defaults to the palette ofplot.boin_decision_table, with its color for elimination used for"STOP"and a violet for"MTD".- ...
Further arguments, currently ignored.
Value
A ggplot2 object, which can be printed, saved with
ggplot2::ggsave() or extended with further layers.
Details
Every cell carries its decision code, so the figure does not rely on color alone. Requires the ggplot2 package, which is only suggested by simFastBOIN rather than required.
Examples
plot(decision_table_3p3())
 plot(decision_table_3p3(mtd_rule = "expand"))