
Stratified Designs
Gosuke Homma
2026-10-28
Source:vignettes/bbssr-stratified.Rmd
bbssr-stratified.RmdDesign and notation
A trial is stratified into
strata, for example by centre or by a baseline factor, and stratum
has
patients in group 1 and
in group 2, both fixed by the design (random sizes are treated in Random stratum and group
sizes). Let
and
be the numbers of responders of the two groups and
the number of responders of the stratum. All tests of the
Strat* functions use
,
the number of responders of group 1 summed over the strata. Given
,
the null expectation of
is
with
,
and each test rejects when
is at most a lower or at least an upper critical value.
The functions follow those for two independent groups:
StratRR(), StratPower() and
StratSampleSize() for the fixed design, and
StratPowerBSSR(), StratGridBSSR(),
StratBSSR(), StratTypeIErrorBSSR() and
StratAlphaAdjBSSR() for blinded sample size
re-estimation.
Tests
Five stratified tests are available. 'CMH' is the
Cochran-Mantel-Haenszel statistic
with the hypergeometric variance
,
and 'Cochran' is Cochran’s statistic with the binomial
variance
,
the statistic of Woolson et al. (1986). 'CMH-cc' and
'Cochran-cc' reduce
by 0.5 when it is at least 0.5, the continuity correction of
stats::mantelhaen.test(). Nam (1992) reduces
by 0.5 in every outcome; the two corrections reject the same outcomes at
one-sided levels up to 0.078, since an outcome with
has a larger one-sided p-value. 'Strat-Fisher' is the
stratified exact conditional test of Jung (2014), which refers
to its distribution given
,
the convolution of the hypergeometric distributions of the strata. Three
unstratified tests, which analyse the table of totals and ignore the
strata, are available for comparison (see Analyses that ignore the
strata).
Jung (2014, Table 2) analyses the response to thymosin in three strata of patients with bronchogenic carcinoma.
thymosin <- array(c(10, 12, 1, 1, 9, 11, 0, 1, 8, 7, 0, 3), c(2, 2, 3))
p.exact <- stats::mantelhaen.test(thymosin, alternative = 'greater', exact = TRUE)$p.value
p.mh <- stats::mantelhaen.test(thymosin, alternative = 'greater', correct = FALSE)$p.value
round(c(exact = p.exact, mh = p.mh), 4)
#>  exact     mh
#> 0.1563 0.0760
The one-sided p-values 0.1563 and 0.0760 are those of Jung (2014) for
the stratified exact test and the Mantel-Haenszel test, which
'Strat-Fisher' and 'CMH' compute in the same
way. StratRR() lists the critical values of a design for
every vector of stratum totals.
rr <- StratRR(N1 = c(10, 12), N2 = c(10, 12), alpha = 0.025, Test = 'Strat-Fisher')
print(rr, n = 6)
#> Rejection region of a stratified test
#>
#>   Test             : Strat-Fisher
#>   Alternative      : greater
#>   Group sizes      : N1 = (10, 12), N2 = (10, 12)
#>   Alpha            : 0.025
#>   Combinations     : 525, of which 457 have a rejected value of S
#>
#>  z.S1 z.S2 S.min S.max lower upper
#>     5    0     0     5    NA     5
#>     6    0     0     6    NA     6
#>     7    0     0     7    NA     7
#>     8    0     0     8    NA     7
#>     9    0     0     9    NA     8
#>    10    0     0    10    NA     8
#>   ... 451 more rows
Power and sample size
The power is the probability of the rejection region when the numbers of responders are binomial in every group and stratum. It is computed exactly for any number of strata and any response probabilities, so the odds ratio need not be common to the strata. The normal approximation to the total sample size is formula (2.8) of Woolson et al. (1986), and with a continuity correction formula (2.3) of Nam (1992). A design is described by the fractions of the strata and the allocation ratio, and the exact search runs over the total sample size within this family.
p2 <- c(0.3, 0.5)
p1 <- p2 * 2.5 / (1 - p2 + p2 * 2.5)
ss.std <- StratSampleSize(p1, p2, frac = c(0.4, 0.6), alpha = 0.025, tar.power = 0.8,
                          Test = 'CMH', method = 'standard')
ss.cmh <- StratSampleSize(p1, p2, frac = c(0.4, 0.6), alpha = 0.025, tar.power = 0.8,
                          Test = 'CMH')
ss.exact <- StratSampleSize(p1, p2, frac = c(0.4, 0.6), alpha = 0.025, tar.power = 0.8,
                            Test = 'Strat-Fisher')
c(standard = ss.std$N, CMH = ss.cmh$N, exact = ss.exact$N)
#> standard      CMH    exact
#>      160      164      176
With a common odds ratio of 2.5, the normal approximation gives a total of 160 patients, at which the exact power of the CMH test is 0.796. The exact search gives 164 patients for the CMH test and 176 for the stratified exact test, whose conditional control of the type I error rate makes it conservative.
Blinded sample size re-estimation
At an interim analysis the numbers of responders of every stratum can
be counted without unblinding. The blinded estimate of the pooled
response probability of stratum
is
divided by the interim size of the stratum. It is divided between the
groups with the assumed effect Delta.A, common to the
strata on the scale effect, and the total sample size is
re-estimated for these probabilities and divided between the strata as
in the planned design. With two strata the final sizes depend on the
interim data only through
,
and the power is computed exactly by enumeration. With a common odds
ratio the planning probabilities of a stratum whose pooled estimate is
close to 0 or 1 are close to each other, so the examples bound the final
total by twice the planned total with N.max.
plan <- StratSampleSize(p1, p2, frac = c(0.5, 0.5), alpha = 0.025, tar.power = 0.8,
                        Test = 'CMH', method = 'standard')
pooled <- (p1 + p2) / 2
res <- StratPowerBSSR(p = rbind(pooled, pooled + 0.1), Delta.A = 2.5, Delta.T = 2.5,
                      N1 = plan$N1, N2 = plan$N2, omega = 0.5, r = 1, alpha = 0.025,
                      tar.power = 0.8, Test = 'CMH', effect = 'OR',
                      ss.method = 'standard', N.max = 2 * plan$N)
res
#> Blinded sample size re-estimation for a stratified design
#>
#>   Test             : CMH
#>   Alternative      : greater
#>   Re-estimation    : normal approximation (unrestricted)
#>   Planned sizes    : (40, 40) and (40, 40)
#>   Interim sizes    : (20, 20) and (20, 20)
#>   Effect           : OR, assumed 2.5, true 2.5
#>   Alpha            : 0.025, target power 0.8
#>
#>       p.S1      p.S2     p1.S1     p1.S2     p2.S1     p2.S2 power.BSSR
#>  0.4086207 0.6071429 0.5172414 0.7142857 0.3000000 0.5000000     0.8122
#>  0.5086207 0.7071429 0.6211596 0.7995566 0.3960818 0.6147291     0.8145
#>  power.TRAD    E.N
#>      0.7963 166.43
#>      0.7821 175.75
When the pooled response probabilities are those of the planning (the first row), the power of the re-estimation design is 0.812 with an expected total of 166.4. When they are 0.1 higher in both strata, the re-estimation adjusts the sample size and the power is 0.814, while that of the fixed design is 0.782.
Type I error rate
Under the null hypothesis both groups of stratum
respond with the probability
.
Given the interim and the second-stage numbers of responders of a
stratum, the numbers of responders of group 1 are hypergeometric
whatever
,
so with two strata the type I error rate is a polynomial in
.
StratTypeIErrorBSSR() computes its coefficients in the
products of the Bernstein bases of the two strata, evaluates it on a
grid, and certifies its largest value over the rectangle spanned by the
grid: the rectangle is subdivided until the largest coefficient of every
piece exceeds the largest value found by at most
.
tie <- StratTypeIErrorBSSR(Delta.A = 2.5, N1 = c(20, 20), N2 = c(20, 20), omega = 0.5,
                           r = 1, alpha = 0.025, tar.power = 0.8, Test = 'CMH',
                           effect = 'OR', ss.method = 'standard', N.max = 160,
                           theta = seq(0.05, 0.95, by = 0.05))
tie
#> Type I error rate of blinded sample size re-estimation for a stratified design
#>
#>   Test             : CMH
#>   Alternative      : greater
#>   Planned sizes    : (20, 20) and (20, 20)
#>   Points           : 361
#>   Maximum          : certified over (theta.S1, theta.S2) in [0.05, 0.95] x [0.05, 0.95]
#>   Alpha            : 0.025
#>
#>        Design  theta.S1  theta.S2       TIE     bound
#>          BSSR 0.3401352 0.3401352 0.0255490 0.0255490
#>  Fixed sample 0.5000000 0.5000000 0.0283368 0.0283368
mx <- attr(tie, 'max')
The largest type I error rate of the re-estimation design with 20 patients per group and stratum is 0.02555, at (0.340, 0.340), and no rate in the rectangle exceeds 0.02555. That of the fixed design is 0.02834.
plot(tie)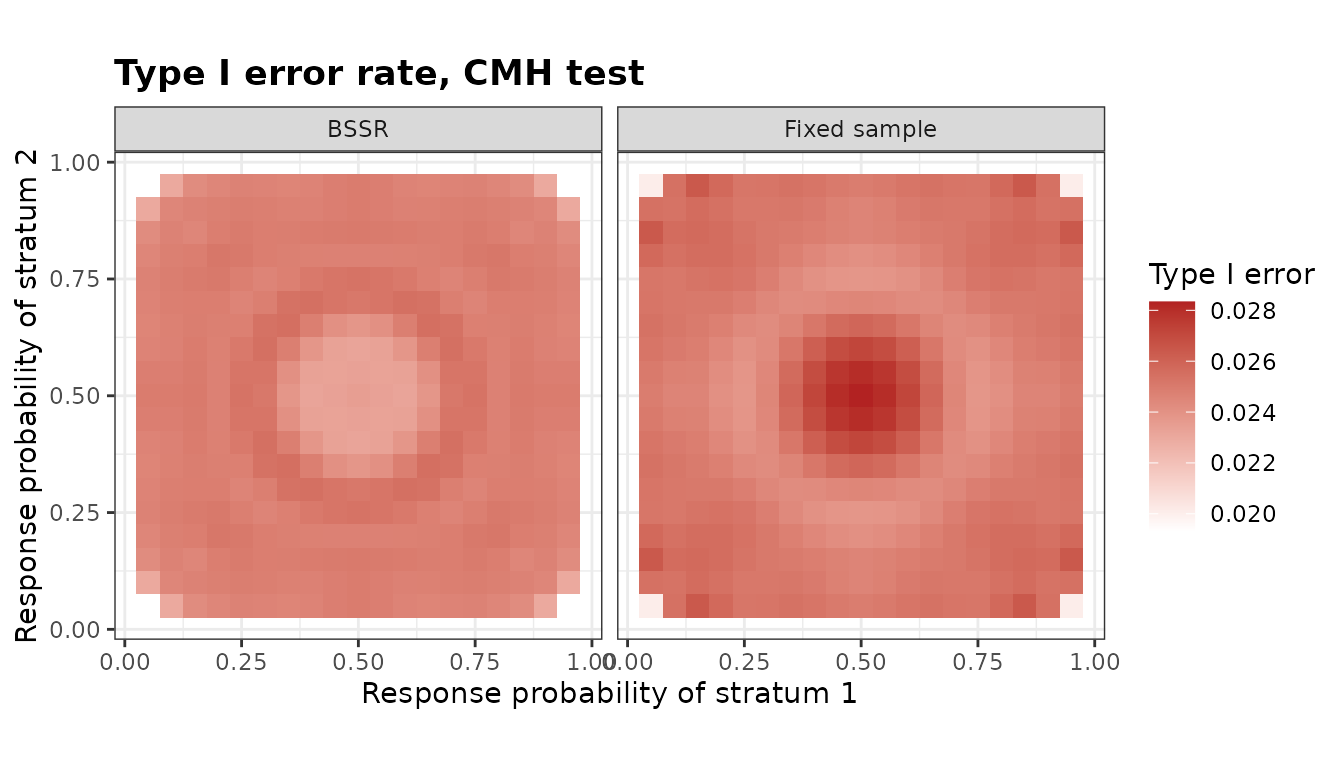
StratAlphaAdjBSSR() lowers the nominal level until the
certified largest rate does not exceed alpha.
adj <- StratAlphaAdjBSSR(Delta.A = 2.5, N1 = c(20, 20), N2 = c(20, 20), omega = 0.5,
                         r = 1, alpha = 0.025, tar.power = 0.8, Test = 'CMH',
                         effect = 'OR', ss.method = 'standard', N.max = 160,
                         theta = seq(0.05, 0.95, by = 0.05))
adj
#> Adjusted significance level for blinded sample size re-estimation
#>
#>   Test            : CMH
#>   Alternative     : greater
#>   Adjusted part   : final analysis only
#>   Maximum         : certified over (theta.S1, theta.S2) in [0.05, 0.95] x [0.05, 0.95]
#>   Target level    : 0.025
#>
#>        Design   max.TIE alpha.adj max.TIE.adj
#>          BSSR 0.0255490 0.0245872   0.0248681
#>  Fixed sample 0.0283368 0.0228356   0.0246744
StratCondRejectBSSR() gives, under the null hypothesis,
the probability of rejection given the pooled numbers of responders of
the strata at the interim analysis and in the second stage. These
probabilities do not depend on
,
and averaging them over the second stage gives the type I error rate
given the interim outcome. Below they are evaluated at the point of the
largest rate found above.
crp <- StratCondRejectBSSR(Delta.A = 2.5, N1 = c(20, 20), N2 = c(20, 20), omega = 0.5,
                           r = 1, alpha = 0.025, tar.power = 0.8, Test = 'CMH',
                           effect = 'OR', ss.method = 'standard', N.max = 160,
                           theta = cbind(mx$theta.S1[1], mx$theta.S2[1]))
crp
#> Conditional rejection probabilities of blinded sample size re-estimation
#> for a stratified design, under equal response probabilities in every stratum
#>
#>   Test             : CMH
#>   Alternative      : greater
#>   Planned sizes    : (20, 20) and (20, 20)
#>   Interim sizes    : (10, 10) and (10, 10)
#>   Assumed effect   : 2.5 (OR)
#>   Nominal level    : 0.025
#>   Interim outcomes : 441 pairs (s1, s2)
#>   Above the level  : 267496 outcomes for CRP, 762792 for CRP.total
#>
#> Largest conditional rejection probability
#>   Quantity   value s1 s2 w1 w2
#>        CRP 0.06250  1  1  1  1
#>  CRP.total 0.06093  1  0  1  2
#>
#> Type I error rate over 1 point: largest 0.02555 at theta = (0.340135, 0.340135)
by.s <- attr(crp, 'by.s')
head(by.s[order(-by.s$contribution), ], 5)
#>      theta.S1  theta.S2 s1 s2     prob.s      TIE.s contribution
#> 155 0.3401352 0.3401352  7  7 0.03371154 0.02640780 0.0008902478
#> 134 0.3401352 0.3401352  7  6 0.03270032 0.02633070 0.0008610225
#> 154 0.3401352 0.3401352  6  7 0.03270032 0.02633070 0.0008610225
#> 133 0.3401352 0.3401352  6  6 0.03171943 0.02617832 0.0008303614
#> 176 0.3401352 0.3401352  7  8 0.02823765 0.02625803 0.0007414652
The contributions of the interim outcomes sum to 0.02555, the largest type I error rate found above.
Analyses that ignore the strata
'Unstrat-Chisq' is Pearson’s chi-squared test of the
table of totals, with
and
patients and
responders, which is the comparison of two proportions with the pooled
variance; 'Unstrat-Chisq-cc' adds the continuity
correction, and 'Unstrat-Fisher' is Fisher’s exact test of
that table. Their critical values depend on
only through
,
but their power and type I error rate are computed with the response
probabilities of each stratum. An unstratified test controls the level
when the strata are distributed alike in the two groups, and its level
can be distorted otherwise (Nam, 1992; Jung, 2014). In the next design
group 1 holds a third of the first stratum, whose patients respond
rarely, and three quarters of the second.
th <- rbind(c(0.2, 0.6), c(0.4, 0.4))
lev <- sapply(c('CMH', 'Strat-Fisher', 'Unstrat-Chisq', 'Unstrat-Fisher'), function(Test) {
  StratPower(th, th, N1 = c(20, 60), N2 = c(40, 20), alpha = 0.025, Test = Test)$Power
})
rownames(lev) <- c('theta = (0.2, 0.6)', 'theta = (0.4, 0.4)')
round(lev, 4)
#>                       CMH Strat-Fisher Unstrat-Chisq Unstrat-Fisher
#> theta = (0.2, 0.6) 0.0264       0.0157        0.5090         0.4348
#> theta = (0.4, 0.4) 0.0247       0.0160        0.0247         0.0166
With the response probabilities 0.2 and 0.6 in the two strata, the one-sided type I error rate of the unstratified chi-squared test is 0.509 instead of 0.025, because the table of totals compares groups made of different mixtures of the strata. When the strata respond alike, the rate is 0.0247.
The re-estimation can ignore the strata as well: with
ss.strata = 'pooled' the sample size is re-estimated from
the proportion of responders among all the interim patients, used for
every stratum, so the final sizes depend only on the total number of
interim responders. The final analysis is still the test given by
Test.
res.pooled <- StratPowerBSSR(p = rbind(pooled, pooled + 0.1), Delta.A = 2.5,
                             Delta.T = 2.5, N1 = plan$N1, N2 = plan$N2, omega = 0.5, r = 1,
                             alpha = 0.025, tar.power = 0.8, Test = 'CMH', effect = 'OR',
                             ss.method = 'standard', N.max = 2 * plan$N,
                             ss.strata = 'pooled')
rbind(stratified = res$E.N, pooled = res.pooled$E.N)
#>                [,1]     [,2]
#> stratified 166.4284 175.7539
#> pooled     157.1181 165.4599
The rows give the expected final totals of the two estimates in the two scenarios of the previous section.
Random stratum and group sizes
When the patients are enrolled one at a time, the size of each
stratum is known only at the end of the enrolment, and the sizes of the
groups within a stratum depend on the randomization. With two strata,
StratPower() describes such a design by its total
N, the fractions of the strata frac and the
allocation ratio r, StratSampleSize() searches
the total for the same description, and alloc chooses how
the sizes are drawn. With alloc = 'stratum' the size of
stratum 1 is binomial with the probability frac[1], and
within each stratum the groups are allocated by permuted blocks of size
block, as in stratified block randomization. With
'group' the size of stratum 1 is fixed at
floor(N * frac[1]), and each patient is in group 1 with the
probability
(Jung, 2014, Section 3.2, where the size of stratum 1 is the round-off
of N * frac[1]; the integer part used here reproduces all
but one of the sample sizes of the column ‘n fixed’ of Table 4 of the
article). With 'both' the stratum sizes are binomial as
well (Jung, 2014, Section 3.1). The power is the sum over the stratum
and group sizes of their probability times the power of the fixed design
they give. Sizes whose probability is below
are left out, and the attribute skipped gives their total
probability, a bound on the error of the power.
alloc.power <- function(alloc) {
  StratPower(p1, p2, alpha = 0.025, Test = 'CMH', alloc = alloc, N = 80,
             frac = c(0.5, 0.5))$Power
}
pw <- c(fixed = StratPower(p1, p2, N1 = c(20, 20), N2 = c(20, 20), alpha = 0.025,
                           Test = 'CMH')$Power,
        stratum = alloc.power('stratum'), group = alloc.power('group'))
round(pw, 4)
#>   fixed stratum   group
#>  0.5171  0.5183  0.4979
For the design of the section on the type I error rate, with 20
patients in each group and stratum and 80 in all, the power of the CMH
test with the planning probabilities is 0.5171 with fixed group sizes,
0.5183 with permuted blocks in random strata and 0.4979 with random
groups in fixed strata. Permuted blocks keep the power within 0.002 of
that with fixed sizes, while binomial group sizes, which vary around the
planned sizes, lower it by about 0.02. The number of configurations of
the sizes grows most quickly with 'both', whose power takes
far longer to compute than with the other models.
StratPowerBSSR(), StratTypeIErrorBSSR(),
StratAlphaAdjBSSR() and StratBSSR() take
alloc and block as well. With two strata the
interim analysis has the first patients enrolled, as many as the interim
total of the design, and the final analysis the first N
patients, where N is the total re-estimated from the
interim data with the fractions of the strata among the interim patients
(ss.frac = 'observed', the default) or with those of the
plan ('planned'). Given an allocation sequence, that is the
strata and the groups of the patients in the order of enrolment, the
design has fixed group sizes and is computed exactly. The power and the
type I error rate are averaged over nseq sequences drawn
with the random numbers of R, and se.BSSR is the Monte
Carlo standard error of the average. The power of the fixed design with
the same allocation is exact.
bssr.small <- function(...) {
  StratPowerBSSR(p = rbind(pooled, pooled + 0.1), Delta.A = 2.5, Delta.T = 2.5,
                 N1 = c(20, 20), N2 = c(20, 20), omega = 0.5, r = 1, alpha = 0.025,
                 tar.power = 0.8, Test = 'CMH', effect = 'OR', ss.method = 'standard',
                 N.max = 160, ...)
}
res.small <- bssr.small()
set.seed(2)
res.alloc <- bssr.small(alloc = 'stratum', nseq = 20)
res.small[, c('power.BSSR', 'power.TRAD', 'E.N')]
#>   power.BSSR power.TRAD      E.N
#> 1  0.7946358  0.5171358 159.2986
#> 2  0.7819219  0.4832641 159.7109
res.alloc[, c('power.BSSR', 'se.BSSR', 'power.TRAD', 'E.N')]
#>   power.BSSR      se.BSSR power.TRAD      E.N
#> 1  0.7954675 0.0004363258  0.5182658 159.3638
#> 2  0.7798800 0.0008324083  0.4879723 159.7567
With fixed group sizes the re-estimation raises the power from
0.5171, that of the fixed design with 80 patients, to 0.7946 in the
first scenario, with an expected total of 159.3 close to the bound of
160. With permuted blocks in random strata and 20 sequences, the power
of the re-estimation design is 0.7955 and 0.7799 in the two scenarios,
with the standard errors 0.00044 and 0.00083, against 0.7946 and 0.7819
with fixed group sizes, and the expected totals are 159.4 and 159.8,
against 159.3 and 159.7. For this design the random sizes change the
power of the re-estimation design by less than 0.01 and its expected
total by less than one patient. The default nseq = 100
divides the standard errors by about 2.2.
Several designs
StratGridBSSR() evaluates several re-estimation designs
over common scenarios, as BinaryGridBSSR() does for two
groups (see vignette('bbssr-design-grid')). Each row of a
data frame is a design, whose columns are arguments of
StratPowerBSSR(); an argument with one value per stratum is
given by the columns with the suffixes .S1,
.S2, and so on, or as a vector shared by all designs.
Below, two tests and two timings of the interim analysis are compared
for the design of the section on the type I error rate, with the pooled
response probability of stratum 2 varying between the scenarios.
design <- expand.grid(Test = c('CMH', 'Cochran'), omega = c(0.3, 0.5),
                      stringsAsFactors = FALSE)
q <- cbind(0.4, c(0.5, 0.6, 0.7))
grid <- StratGridBSSR(design, p = q, Delta.A = 2.5, effect = 'OR', N1 = c(20, 20),
                      N2 = c(20, 20), r = 1, alpha = 0.025, tar.power = 0.8,
                      ss.method = 'standard', N.max = 160)
summary(grid)[, c('Test', 'omega', 'power.BSSR.min', 'power.BSSR.max', 'E.N.max')]
#>      Test omega power.BSSR.min power.BSSR.max  E.N.max
#> 1     CMH   0.3      0.7761882      0.8008585 159.7052
#> 2 Cochran   0.3      0.7804618      0.8036203 159.7052
#> 3     CMH   0.5      0.7764089      0.7998569 159.7730
#> 4 Cochran   0.5      0.7807565      0.8027385 159.7730
The summary gives the range of the power of each design over the scenarios and its largest expected total sample size. The plot draws the power against the probability that varies between the scenarios, here that of stratum 2, with the fixed design as dashed lines.
plot(grid, colour.by = 'Test', facet.by = 'omega')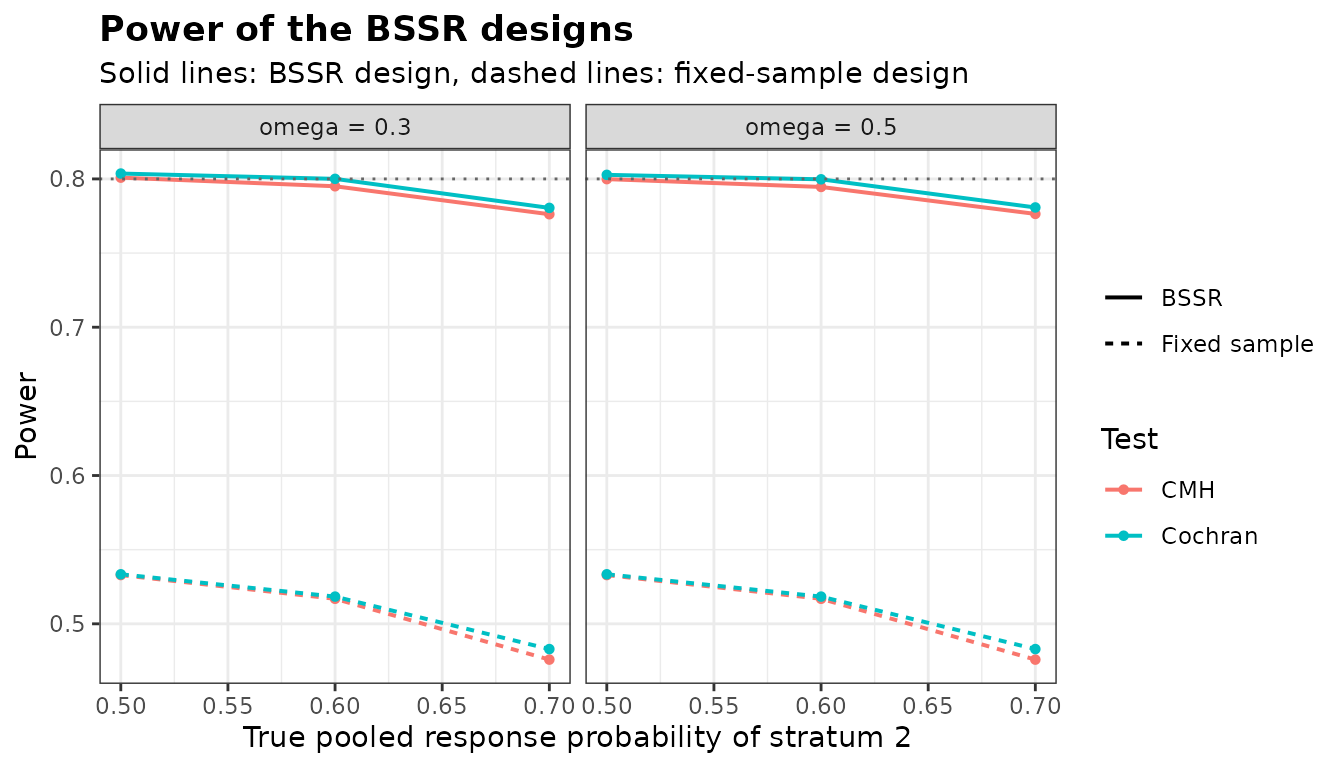
Three or more strata
With three or more strata the number of interim outcomes grows as a
product over the strata, and StratPowerBSSR() and
StratTypeIErrorBSSR() estimate the rates of the
re-estimation design by simulation, with the random numbers of R and a
Monte Carlo standard error. With fixed group sizes the rates of the
fixed design remain exact. With alloc = 'stratum' or
'both' the strata and the groups of the patients are
simulated with the responses, in the fixed design as well, whose
standard error is se.TRAD. The model 'group'
needs two strata.
set.seed(1)
q2 <- c(0.2, 0.35, 0.5)
q1 <- q2 * 2.5 / (1 - q2 + q2 * 2.5)
plan3 <- StratSampleSize(q1, q2, frac = c(0.3, 0.3, 0.4), alpha = 0.025,
                         tar.power = 0.8, Test = 'CMH', method = 'standard')
res3 <- StratPowerBSSR(p = (q1 + q2) / 2, Delta.A = 2.5, Delta.T = 2.5, N1 = plan3$N1,
                       N2 = plan3$N2, omega = 0.5, r = 1, alpha = 0.025, tar.power = 0.8,
                       Test = 'CMH', effect = 'OR', ss.method = 'standard',
                       N.max = 2 * plan3$N, nsim = 2e4)
res3[, c('power.BSSR', 'se.BSSR', 'power.TRAD', 'E.N')]
#>   power.BSSR     se.BSSR power.TRAD      E.N
#> 1    0.82235 0.002702688  0.8033501 175.9536
References
Jung, S. H. (2014). Stratified Fisher’s exact test and its sample size calculation. Biometrical Journal, 56, 129-140.
Nam, J. (1992). Sample size determination for case-control studies and the comparison of stratified and unstratified analyses. Biometrics, 48, 389-395.
Woolson, R. F., Bean, J. A. and Rojas, P. B. (1986). Sample size for case-control studies using Cochran’s statistic. Biometrics, 42, 927-932.