
Type I Error Rate of a Re-estimation Design
Gosuke Homma
2026-10-28
Source:vignettes/bbssr-type1-error.Rmd
bbssr-type1-error.RmdThe type I error rate of a re-estimation design
With blinded sample size re-estimation the final sample size depends on the pooled number of interim responders, whose distribution depends on the common response probability . The type I error rate of a re-estimation design is computed for the design itself, by summing the rejection probability over the interim outcomes and the outcomes of the second stage.
Under the null hypothesis . Let and be the interim sample sizes of the two groups, the pooled number of interim responders, and the second-stage sample sizes reached from , and the rejection region at the final sample size reached from . The type I error rate is a polynomial in that the package evaluates exactly.
The rate over the nuisance parameter
BinaryTypeIErrorBSSR() evaluates the type I error rate
of a re-estimation design and of the fixed-sample design with the
initial sample size over a grid of
,
by default seq(0, 1, by = 0.005). The largest value is not
read off the grid. With the default maximize = 'certified'
the function finds the largest value over the whole interval spanned by
the grid, here
,
together with an upper bound that the rate does not exceed anywhere in
that interval. The bbssr-statistical-methods vignette
describes the method. The design below has an assumed difference of 0.3,
an initial sample size of 39 per group, an interim analysis after 20 per
group, re-estimation by formula (21.3) of Kieser (2020) and the
chi-squared test.
design <- list(Delta.A = 0.3, N1 = 39, N2 = 39, n.interim = c(20, 20), r = 1,
               alpha = 0.025, tar.power = 0.8, Test = 'Chisq', ss.method = 'standard')
tie <- do.call(BinaryTypeIErrorBSSR, design)
tie
#> Type I error rate of blinded sample size re-estimation for a binary endpoint
#>
#>   Test            : Chisq
#>   Alternative     : greater
#>   Initial size    : N1 = 39, N2 = 39
#>   Interim size    : n1 = 20, n2 = 20
#>   Assumed effect  : 0.3 (RD)
#>   Nominal level   : 0.025
#>   Grid            : 201 values of theta in [0, 1]
#>   Maximum         : certified over theta in [0, 1]
#>
#> Largest type I error rate
#>        Design     theta     TIE
#>          BSSR 0.4376830 0.02729
#>  Fixed sample 0.0935669 0.02938
attr(tie, 'max')
#>   Design      theta        TIE      bound
#> 1   BSSR 0.43768311 0.02728643 0.02728643
#> 2   TRAD 0.09356689 0.02937611 0.02937611
plot(tie)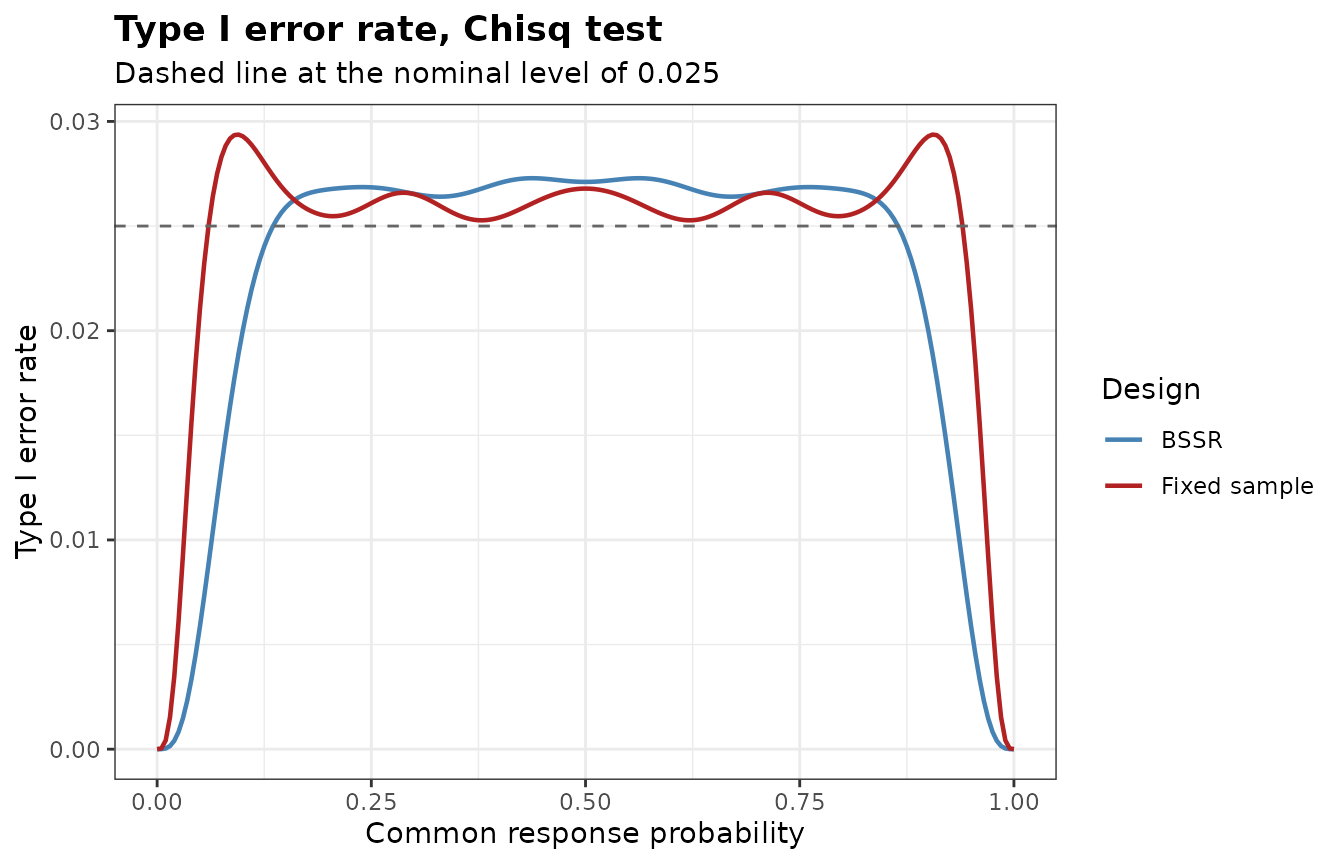
The largest type I error rate is 0.02729 at
0.4377 for the re-estimation design and 0.02938 at
0.09357 for the fixed-sample design. The column bound of
the attribute max exceeds these values by at most
,
so the largest rates are known to that accuracy whatever the spacing of
the grid. The chi-squared test is not exact, so the fixed-sample design
can already exceed the nominal level, and the re-estimation changes the
rate again.
Exact tests in the final analysis
The same design with an exact test in the final analysis gives the following largest rates.
exact.max <- do.call(rbind, lapply(c('Fisher', 'Boschloo'), function(tst) {
  m <- attr(do.call(BinaryTypeIErrorBSSR, modifyList(design, list(Test = tst))), 'max')
  data.frame(Test = tst, Design = m$Design, theta = signif(m$theta, 4),
             TIE = signif(m$TIE, 4))
}))
exact.max
#>       Test Design  theta     TIE
#> 1   Fisher   BSSR 0.4741 0.01573
#> 2   Fisher   TRAD 0.5000 0.01540
#> 3 Boschloo   BSSR 0.3726 0.02312
#> 4 Boschloo   TRAD 0.4543 0.02477
For this rule the largest rate of the re-estimation design is 0.01573 with Fisher’s exact test and 0.02312 with the Boschloo test, against the nominal 0.025.
The adjusted significance level
When the rate exceeds the nominal level,
BinaryAlphaAdjBSSR() lowers the nominal level until the
largest type I error rate does not exceed the target level, following
Kieser and Friede (2000) and Friede and Kieser (2004). With
adjust = 'test' (the default) the adjusted level is applied
to the final analysis only. The re-estimated sample sizes then do not
depend on the level, the largest rate is a non-decreasing step function
of it, and the level is found by bisection. Every level between the
largest p-value that is rejected and the smallest p-value that is not
gives the same rejection regions, and the reported level is the largest
value with at most six significant digits in that range, so it can be
used as printed.
Both searches below use the grid theta.grid from 0.01 to
0.99 in steps of 0.01, which is coarser than the default to keep them
short. The grid serves the search: a level is assessed on the grid, and
with the default maximize = 'certified' the level found is
accepted only if the upper bound of the type I error rate over the whole
interval
does not exceed the target level. The columns max.TIE.bound
and max.TIE.adj.bound of the result hold the bounds at the
nominal and at the adjusted level.
theta.grid <- seq(0.01, 0.99, by = 0.01)
adj <- do.call(BinaryAlphaAdjBSSR, c(design, list(theta = theta.grid)))
adj
#> Adjusted significance level for blinded sample size re-estimation
#>
#>   Test            : Chisq
#>   Alternative     : greater
#>   Adjusted part   : final analysis only
#>   Maximum         : certified over theta in [0.01, 0.99]
#>   Target level    : 0.025
#>
#>        Design   max.TIE alpha.adj max.TIE.adj
#>          BSSR 0.0272864 0.0204375   0.0237418
#>  Fixed sample 0.0293761 0.0207700   0.0247660
With adjust = 'both' the adjusted level is used in the
re-estimation as well. The re-estimated sample sizes then change with
the level, the rate need not be monotone in it, and the level is lowered
in steps of step until the rate is controlled. The result
is the first level on this grid of steps at which the rate is
controlled. The levels that control the rate need not form an interval,
so the result can change with the step. The published values of Friede
and Kieser (2004, Section 5) and Kieser (2020, Example 21.1) are
reproduced only when the re-estimation also uses the adjusted level, as
the script reproduce-published.R shows (see the
bbssr-validation vignette). The search below uses a step of
0.00005, coarser than the default, to keep it short.
adj.both <- do.call(BinaryAlphaAdjBSSR,
                    c(design, list(adjust = 'both', step = 5e-5, theta = theta.grid)))
adj.both
#> Adjusted significance level for blinded sample size re-estimation
#>
#>   Test            : Chisq
#>   Alternative     : greater
#>   Adjusted part   : final analysis and re-estimation
#>   Maximum         : certified over theta in [0.01, 0.99]
#>   Target level    : 0.025
#>
#>        Design   max.TIE alpha.adj max.TIE.adj
#>          BSSR 0.0272864   0.02110   0.0246043
#>  Fixed sample 0.0293761   0.02077   0.0247660
The adjusted level of the re-estimation design is 0.0204375 when it
applies to the final analysis only and 0.0211 when it also applies to
the re-estimation. At these levels the upper bounds of the type I error
rate over
are 0.02374 and 0.0246. The power at the adjusted level follows from
BinaryPowerBSSR() with alpha set to the
adjusted level. The re-estimation keeps the target level through
ss.alpha when the level was adjusted with
adjust = 'test'.
adjusted <- modifyList(design, list(alpha = adj$alpha.adj[1], ss.alpha = 0.025))
power.adj <- do.call(BinaryPowerBSSR,
                     c(adjusted, list(p = c(0.3, 0.4, 0.5), Delta.T = 0.3)))
power.nominal <- do.call(BinaryPowerBSSR,
                         c(design, list(p = c(0.3, 0.4, 0.5), Delta.T = 0.3)))
data.frame(p = power.adj$p, power.nominal = round(power.nominal$power.BSSR, 4),
           power.adjusted = round(power.adj$power.BSSR, 4))
#>     p power.nominal power.adjusted
#> 1 0.3        0.7984         0.7730
#> 2 0.4        0.8031         0.7685
#> 3 0.5        0.8037         0.7646
Control within a confidence interval
The largest type I error rate over the whole range of the nuisance
parameter can occur at values that the data of the completed trial make
implausible. Kieser (2020, Section 22.1.3) describes another way to
control the type I error rate. A value
is fixed in advance, the
confidence interval for the nuisance parameter is computed from the data
of the completed trial, and the final analysis uses a level at which the
largest type I error rate over this interval does not exceed
.
The type I error rate is then controlled at
.
BinaryAlphaAdjBSSR() finds this level when
theta spans the interval and alpha is set to
.
The interval is known only at the end of the trial, so the re-estimation
keeps the nominal level, through adjust = 'test' and
ss.alpha.
Example 23.1 of Kieser (2020) applies the approach to the FreezeAF
trial, a non-inferiority trial with the margin 0.15 and the test of
Farrington and Manning (1990), equal assumed rates of 0.78, an initial
sample size of 122 per group and a pilot of 100 patients. The rate is
evaluated on the boundary of the null hypothesis against the pooled
response probability, as described in the
bbssr-non-inferiority vignette, on the grid of the book
with steps of 0.005. For control over the whole range, the book applies
the adjusted level to the re-estimation as well, which is
adjust = 'both'. A step of 0.0001 keeps the search
short.
freeze <- list(Delta.A = 0, N1 = 122, N2 = 122, n.interim = c(50, 50), r = 1,
               alpha = 0.025, tar.power = 0.8, Test = 'Farrington-Manning',
               ss.method = 'standard', margin = 0.15)
adj.whole <- do.call(BinaryAlphaAdjBSSR,
                     c(freeze, list(theta = seq(0.075, 0.925, by = 0.005),
                                    maximize = 'grid', adjust = 'both', step = 1e-4)))
adj.whole[1, c('Design', 'max.TIE', 'alpha.adj', 'max.TIE.adj', 'theta.adj')]
#>   Design    max.TIE alpha.adj max.TIE.adj theta.adj
#> 1   BSSR 0.02644929    0.0241  0.02492749      0.85
The trial observed 210 responders among 291 patients. With
the interval is the 99.99 per cent Clopper-Pearson interval, which
binom.test() returns. The book calls it a 95 per cent
interval, but the interval it gives is the 99.99 per cent interval. The
code below computes the largest type I error rate within the interval at
the nominal level and the adjusted level.
gamma <- 1e-4
ci <- binom.test(210, 291, conf.level = 1 - gamma)$conf.int
ci.grid <- seq(ci[1], ci[2], length.out = 42)
tie.ci <- do.call(BinaryTypeIErrorBSSR,
                  c(freeze, list(theta = ci.grid, maximize = 'grid')))
adj.ci <- do.call(BinaryAlphaAdjBSSR,
                  c(modifyList(freeze, list(alpha = 0.025 - gamma)),
                    list(ss.alpha = 0.025, theta = ci.grid, maximize = 'grid')))
adj.ci[1, c('Design', 'alpha', 'alpha.adj', 'max.TIE.adj', 'theta.adj')]
#>   Design  alpha alpha.adj max.TIE.adj theta.adj
#> 1   BSSR 0.0249 0.0241286  0.02489991 0.7662331
Within the interval
the largest rate of the re-estimation design is 0.026, only slightly
below the largest rate 0.0264 over the whole range, as the book notes.
The adjusted level that keeps the rate within the interval at or below
is 0.0241, and the level that controls the rate over the whole range is
0.0241. The book reports 0.0241 for both, and
reproduce-published.R reproduces these values with a step
of
(see the bbssr-validation vignette).
Conditional rejection probabilities
BinaryCondRejectBSSR() takes the calculation apart.
Given the pooled number
of interim responders and the pooled number
of second-stage responders, the number of responders of group 1 in each
stage is hypergeometric under the null hypothesis, and the two stages
are independent. The rejection probability given
and
,
where
and
are the hypergeometric probabilities of the two stages, does not depend
on
.
The type I error rate is its average over the binomial distributions of
and
,
where
is the binomial probability. The column CRP.total is the
rejection probability given only the total
,
with the responder count of group 1 treated as one hypergeometric count
among all final patients.
crp <- BinaryCondRejectBSSR(
  Delta.A = 0.3, N1 = 12, N2 = 12, n.interim = c(6, 6), r = 1, alpha = 0.025,
  tar.power = 0.8, Test = 'Chisq', ss.method = 'standard', theta = c(0.3, 0.5)
)
crp
#> Conditional rejection probabilities of blinded sample size re-estimation
#> for a binary endpoint, under equal response probabilities
#>
#>   Test            : Chisq
#>   Alternative     : greater
#>   Initial size    : N1 = 12, N2 = 12
#>   Interim size    : n1 = 6, n2 = 6
#>   Assumed effect  : 0.3 (RD)
#>   Nominal level   : 0.025
#>   Outcomes        : 567 pairs (s, s2)
#>   Above the level : 198 for CRP, 264 for CRP.total
#>
#> Largest conditional rejection probability
#>   Quantity   value s s2 N1 N2
#>        CRP 0.05519 2  2 24 24
#>  CRP.total 0.05753 4  0 38 38
#>
#> Type I error rate over 2 values of theta: largest 0.02762 at theta = 0.5
plot(crp)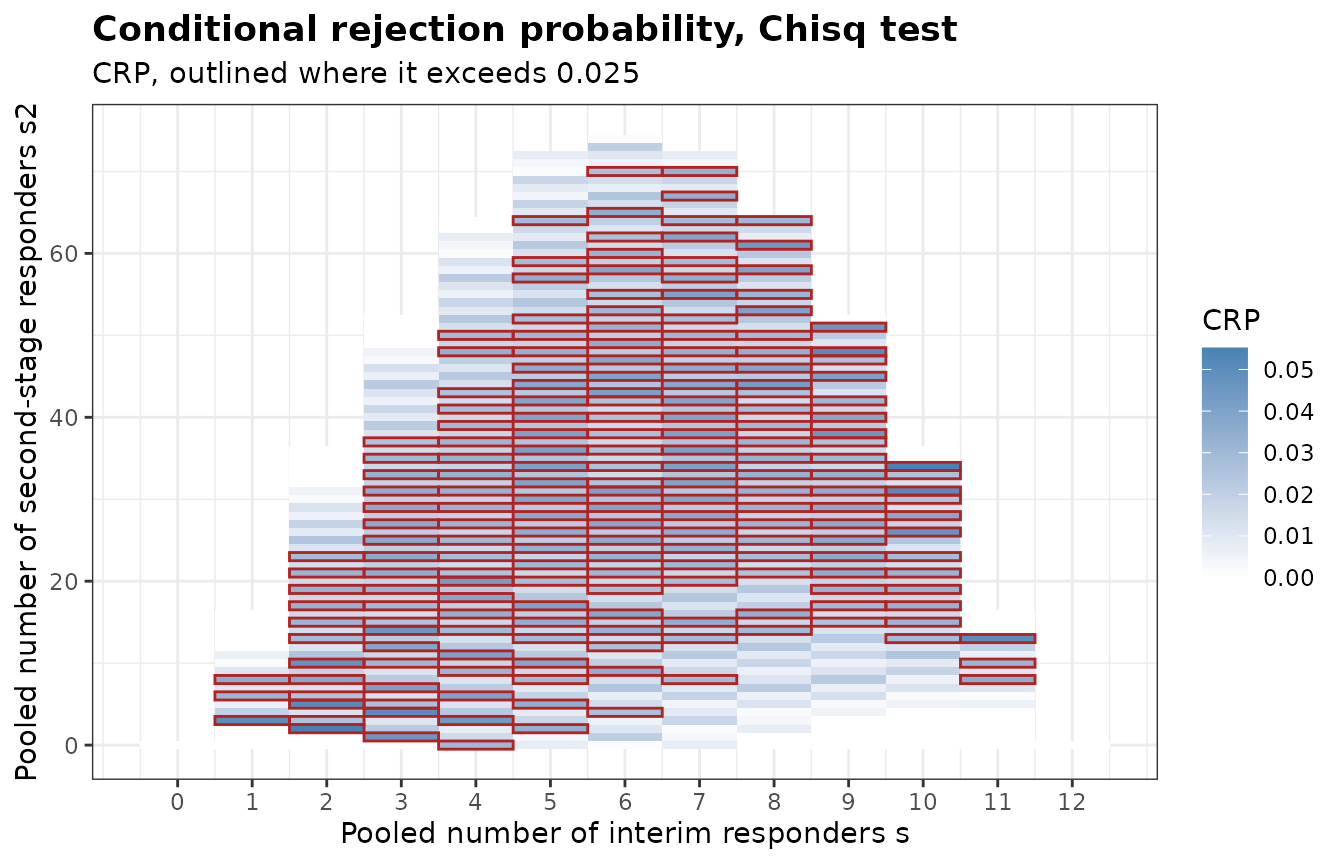
The decomposition by
is returned when theta is given.
by.s <- attr(crp, 'by.s')
head(by.s)
#>   theta s N1 N2     prob.s      TIE.s contribution
#> 1   0.3 0  6  6 0.01384129 0.00000000  0.000000000
#> 2   0.3 1 14 14 0.07118376 0.02078361  0.001479455
#> 3   0.3 2 24 24 0.16779030 0.02603899  0.004369090
#> 4   0.3 3 32 32 0.23970043 0.02648734  0.006349026
#> 5   0.3 4 38 38 0.23113970 0.02684226  0.006204313
#> 6   0.3 5 42 42 0.15849579 0.02550149  0.004041879
attr(crp, 'TIE')
#>   theta        TIE
#> 1   0.3 0.02537642
#> 2   0.5 0.02761990
plot(crp, what = 'by.s')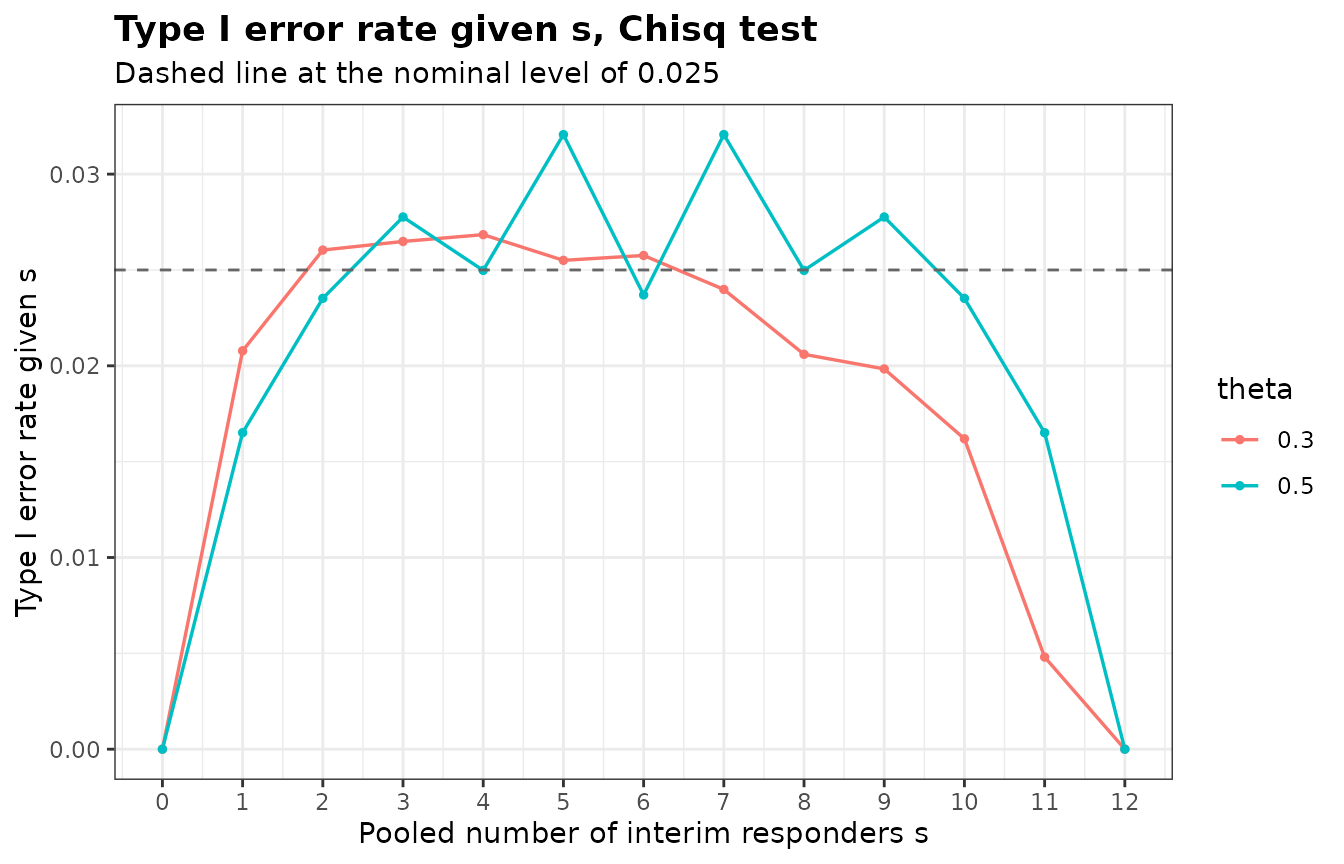
TIE.s is the type I error rate given
,
and contribution is its product with the probability
prob.s of
.
The contributions add up to the type I error rate at each value of
theta, which is 0.02538 and 0.02762 here.
Non-inferiority
With a non-inferiority margin, BinaryTypeIErrorBSSR()
and BinaryAlphaAdjBSSR() evaluate the rate on the boundary
of the null hypothesis, parametrized by the pooled response probability,
see the bbssr-non-inferiority vignette.
BinaryCondRejectBSSR() covers tests of superiority only,
since on the boundary of a non-inferiority hypothesis the two response
probabilities differ and the conditional distributions of the responder
counts depend on them.
References
Farrington, C. P. and Manning, G. (1990). Test statistics and sample size formulae for comparative binomial trials with null hypothesis of non-zero risk difference or non-unity relative risk. Statistics in Medicine, 9, 1447-1454.
Friede, T. and Kieser, M. (2004). Sample size recalculation for binary data in internal pilot study designs. Pharmaceutical Statistics, 3, 269-279.
Kieser, M. (2020). Methods and Applications of Sample Size Calculation and Recalculation in Clinical Trials. Springer.
Kieser, M. and Friede, T. (2000). Re-calculating the sample size in internal pilot study designs with control of the type I error rate. Statistics in Medicine, 19, 901-911.