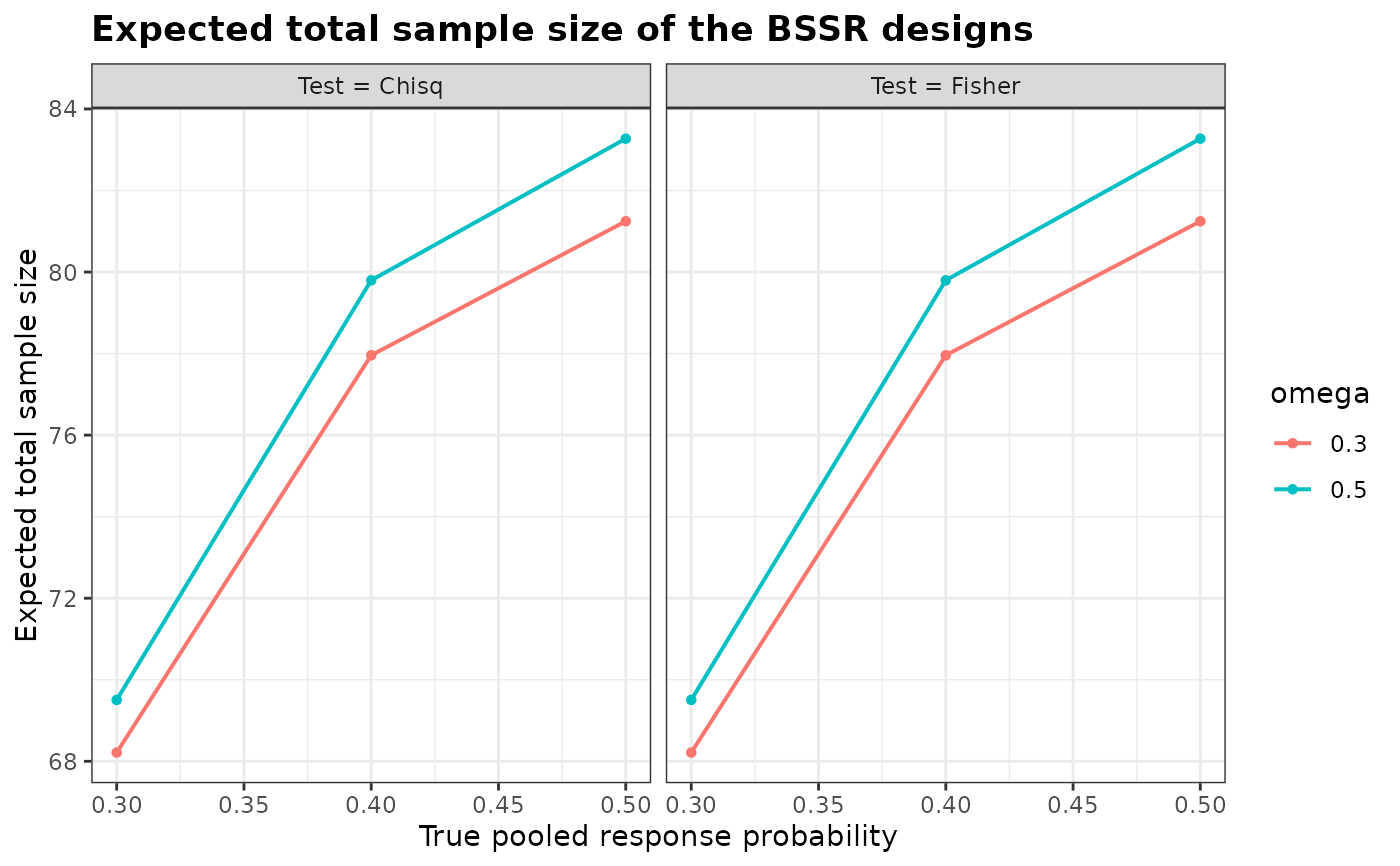
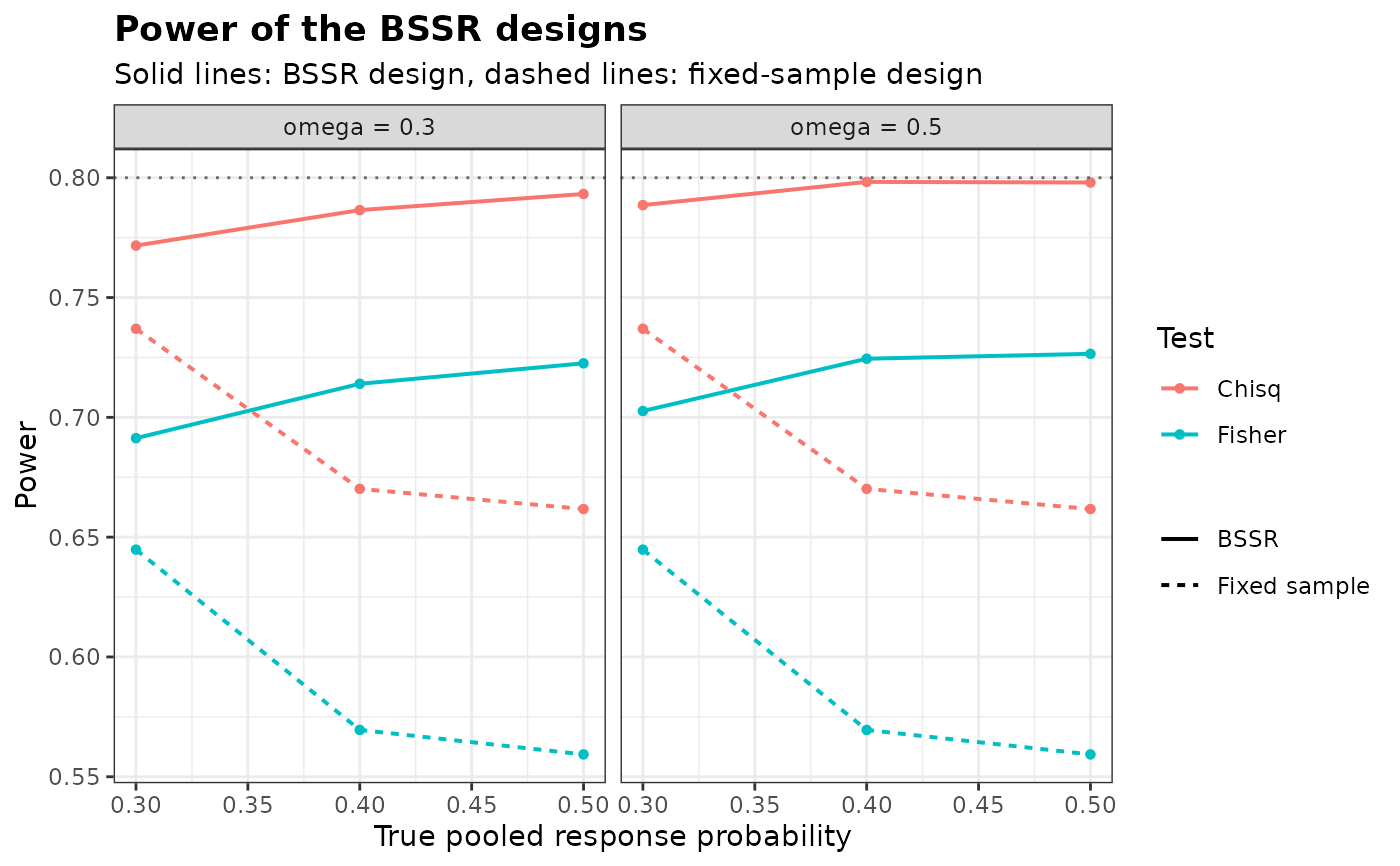
Draws the power or the expected total sample size of the designs of
BinaryGridBSSR against the true pooled response probability, with one
colour per value of a chosen column and, optionally, one panel per value of another.
Arguments
- x
An object of class
bbssr_grid- what
Quantity to draw.
'power'(default) draws the power of the BSSR designs as solid lines and that of the fixed-sample designs as dashed lines.'E.N'draws the expected total sample size of the BSSR designs- colour.by
Name of the column of
xwhose values are told apart by colour. The default ofNULLuses the indexdesign- facet.by
Name of a column of
xwhose values are drawn in separate panels, orNULL(default) for a single panel- main
Title.
NULLkeeps the default andNAremoves it- sub
Subtitle.
NULLkeeps the default andNAremoves it- xlab
Label of the horizontal axis.
NULLkeeps the default- ylab
Label of the vertical axis.
NULLkeeps the default- ref.line
Height of the dotted reference line for
what = 'power'.NULLdraws it at the target power when all designs share one, andNAremoves it- legend.title
Title of the colour legend.
NULLusescolour.by- base_size
Base font size passed to
theme_bw()- ...
Further arguments, ignored
Examples
design <- expand.grid(Test = c('Chisq', 'Fisher'), omega = c(0.3, 0.5),
stringsAsFactors = FALSE)
grid <- BinaryGridBSSR(design, p = c(0.3, 0.4, 0.5), Delta.A = 0.3, N1 = 30, N2 = 30,
r = 1, alpha = 0.025, tar.power = 0.8, ss.method = 'standard')
plot(grid, colour.by = 'Test', facet.by = 'omega')
 plot(grid, what = 'E.N', colour.by = 'omega', facet.by = 'Test')