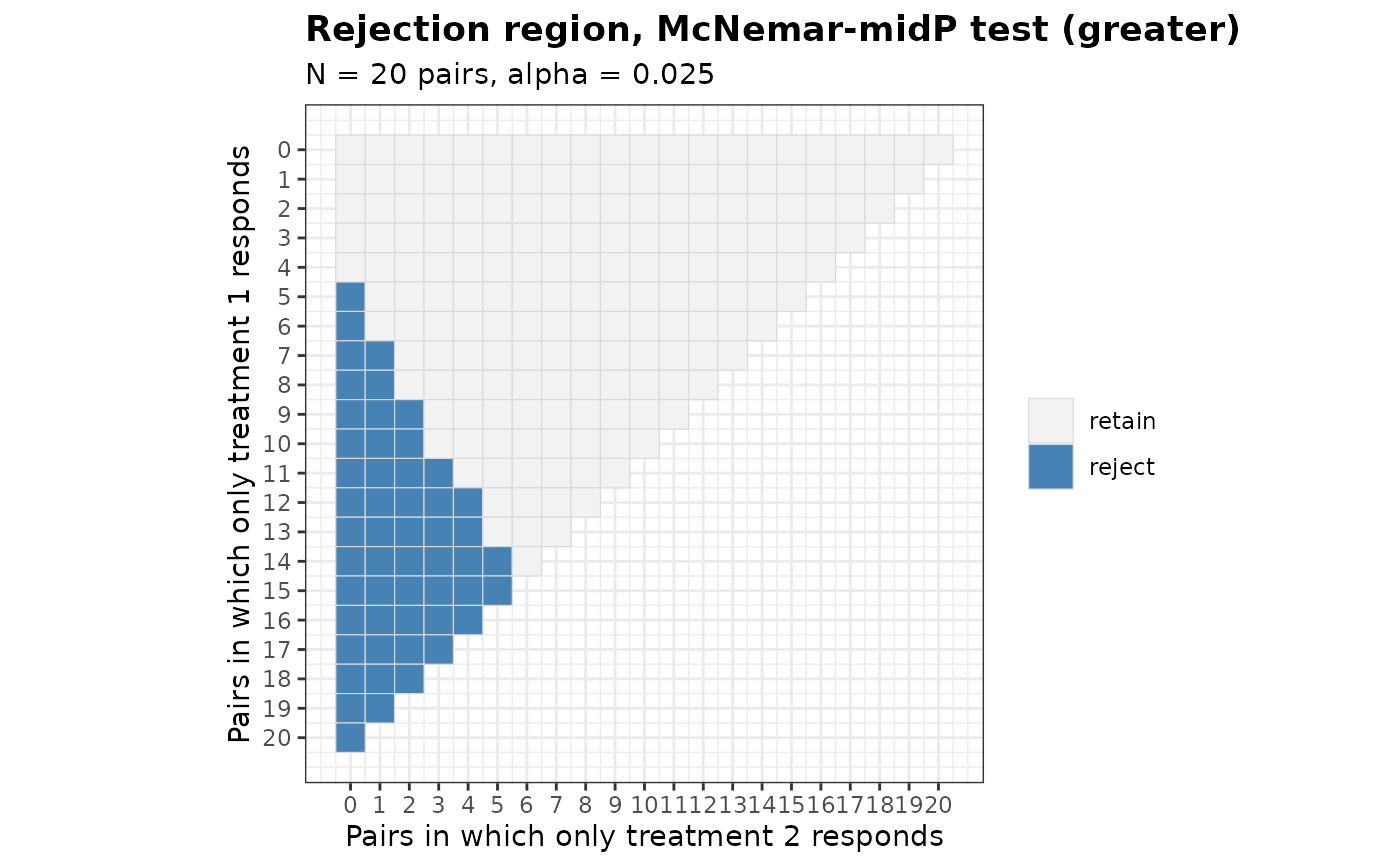
Displays the possible outcomes of a matched-pairs trial and shades the outcomes for which the null hypothesis is rejected.
Usage
# S3 method for class 'bbssr_prr'
plot(
  x,
  main = NULL,
  sub = NULL,
  xlab = NULL,
  ylab = NULL,
  legend.title = NULL,
  legend.labels = NULL,
  colours = NULL,
  base_size = 11,
  ...
)
Arguments
- x
An object of class
bbssr_prrreturned byPairedRR- main
Title of the plot. The default of
NULLbuilds the title from the object and a singleNAdrops it- sub
Subtitle of the plot, following the convention of
main- xlab
Label of the horizontal axis, following the convention of
main- ylab
Label of the vertical axis, following the convention of
main- legend.title
Title of the legend. The default of
NULLleaves the legend untitled- legend.labels
Character vector of length two replacing the entries of the legend, in the order retained then rejected
- colours
Character vector of length two giving the fill of the tiles, in the order retained then rejected
- base_size
Base font size of the theme, in points
- ...
Further arguments, currently ignored
Details
The vertical axis counts the pairs in which only treatment 1 responds and runs
downwards, and the horizontal axis counts the pairs in which only treatment 2 responds,
as in the map printed by print.bbssr_prr. Only the possible outcomes, with
at most N discordant pairs, are drawn.