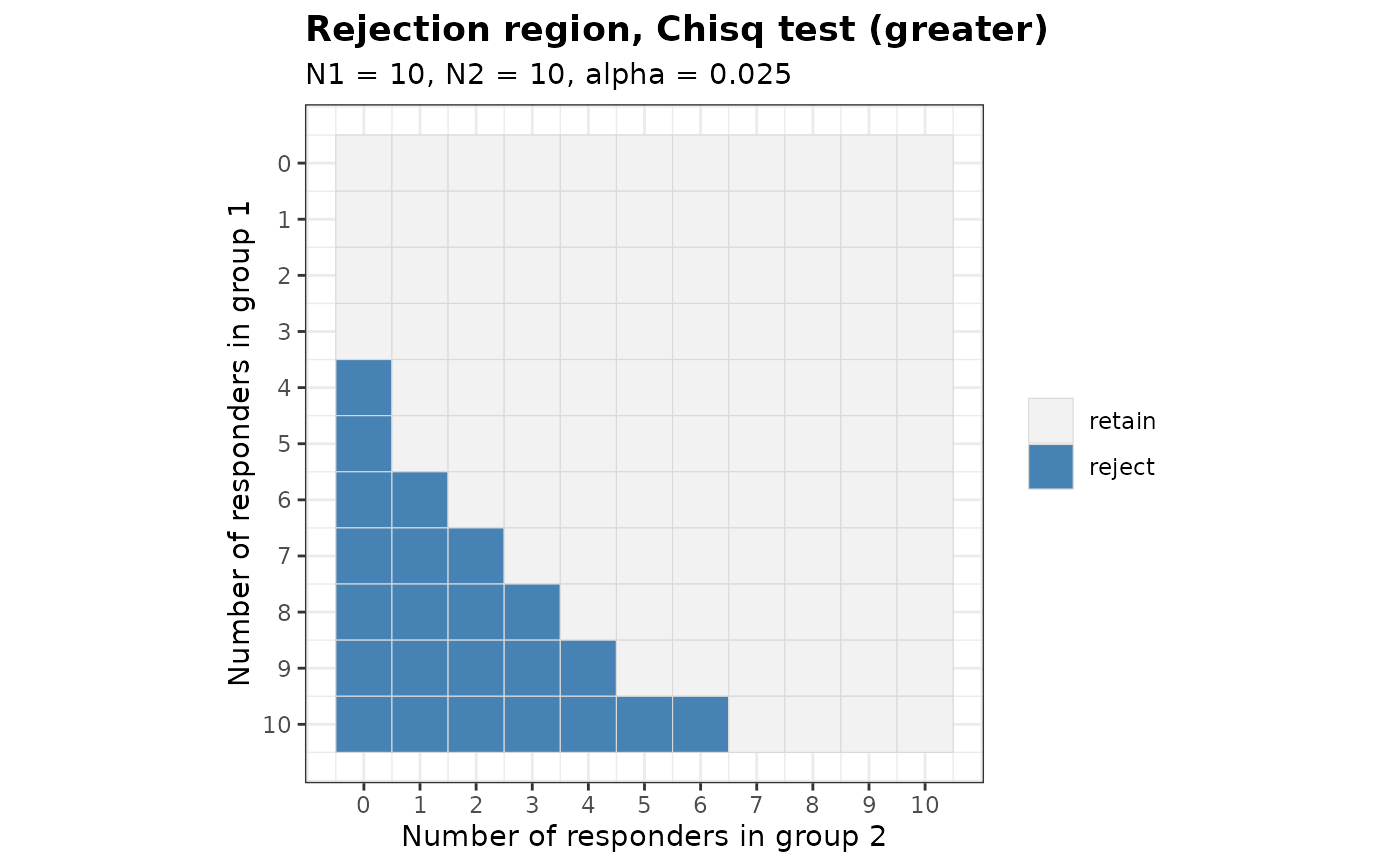
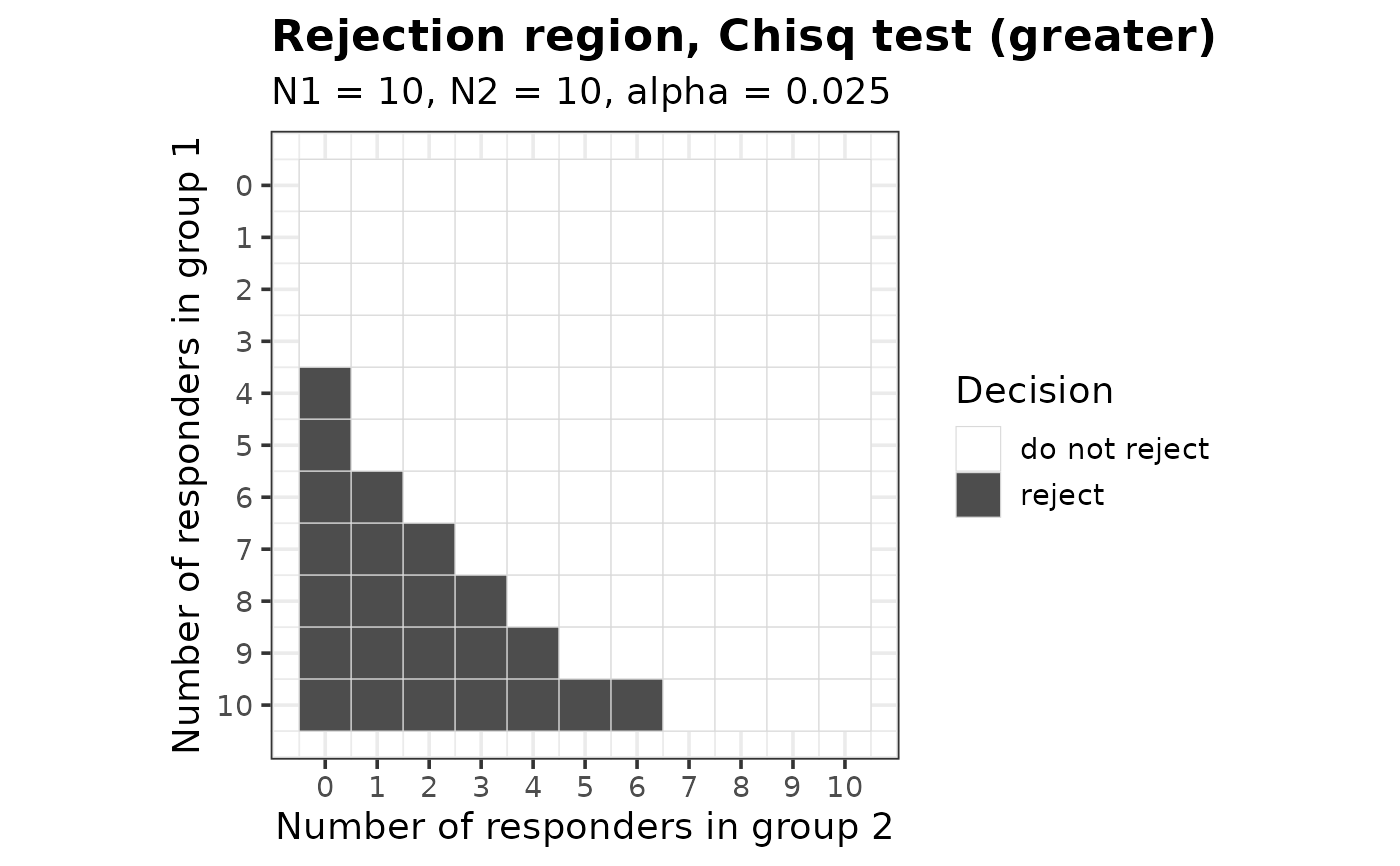
Displays the outcome grid of a two-arm trial with a binary endpoint and shades the outcomes for which the null hypothesis is rejected.
Usage
# S3 method for class 'bbssr_rr'
plot(
  x,
  main = NULL,
  sub = NULL,
  xlab = NULL,
  ylab = NULL,
  legend.title = NULL,
  legend.labels = NULL,
  colours = NULL,
  base_size = 11,
  ...
)
Arguments
- x
An object of class
bbssr_rrreturned byBinaryRR- main
Title of the plot. The default of
NULLbuilds the title from the object and a singleNAdrops it- sub
Subtitle of the plot, following the convention of
main- xlab
Label of the horizontal axis, following the convention of
main- ylab
Label of the vertical axis, following the convention of
main- legend.title
Title of the legend. The default of
NULLleaves the legend untitled- legend.labels
Character vector of length two replacing the entries of the legend, in the order retained then rejected
- colours
Character vector of length two giving the fill of the tiles, in the order retained then rejected
- base_size
Base font size of the theme, in points
- ...
Further arguments, currently ignored
Details
Both axes count responders, so the breaks are restricted to integers. The vertical axis
runs downwards, which places the outcome with no responders in the top left corner and
matches the layout of the map printed by print.bbssr_rr.