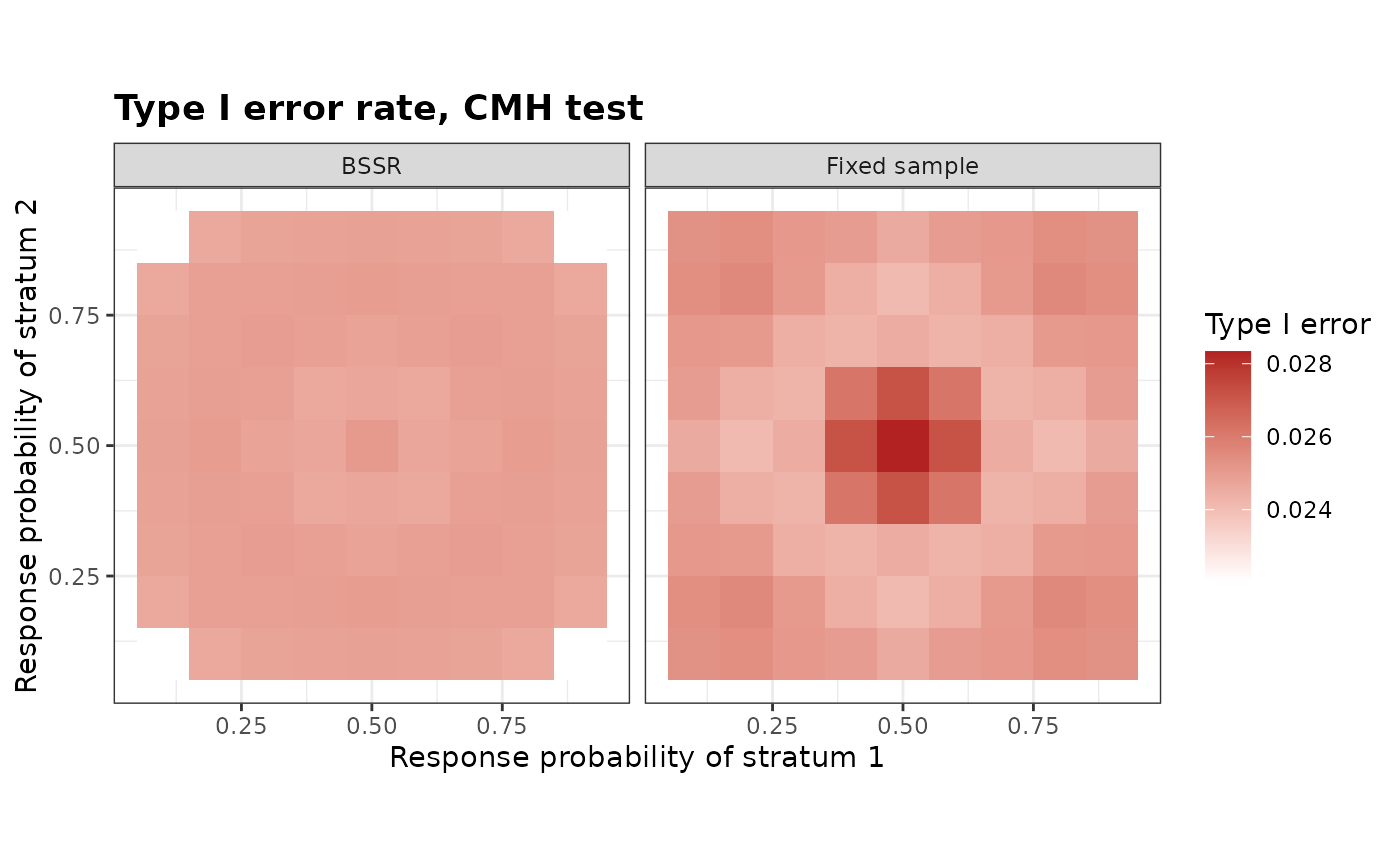
Plots the type I error rate of a two-stratum design with blinded sample size re-estimation and of the fixed design over the grid of common response probabilities of the two strata, as two heat maps.
Usage
# S3 method for class 'bbssr_stie'
plot(
  x,
  main = NULL,
  xlab = NULL,
  ylab = NULL,
  low = "white",
  high = "firebrick",
  base_size = 11,
  ...
)
Arguments
- x
An object of class
bbssr_stiewith two strata, computed on a grid- main
Title, or
NULLfor the default- xlab
Label of the horizontal axis, or
NULLfor the default- ylab
Label of the vertical axis, or
NULLfor the default- low
Colour of the smallest rate. Default is
'white'- high
Colour of the largest rate. Default is
'firebrick'- base_size
Base font size. Default is 11
- ...
Further arguments, ignored
Examples
tie <- StratTypeIErrorBSSR(Delta.A = 0.2, N1 = c(20, 20), N2 = c(20, 20), omega = 0.5,
                           r = 1, alpha = 0.025, tar.power = 0.8, Test = 'CMH',
                           ss.method = 'standard', theta = seq(0.1, 0.9, by = 0.1))
plot(tie)