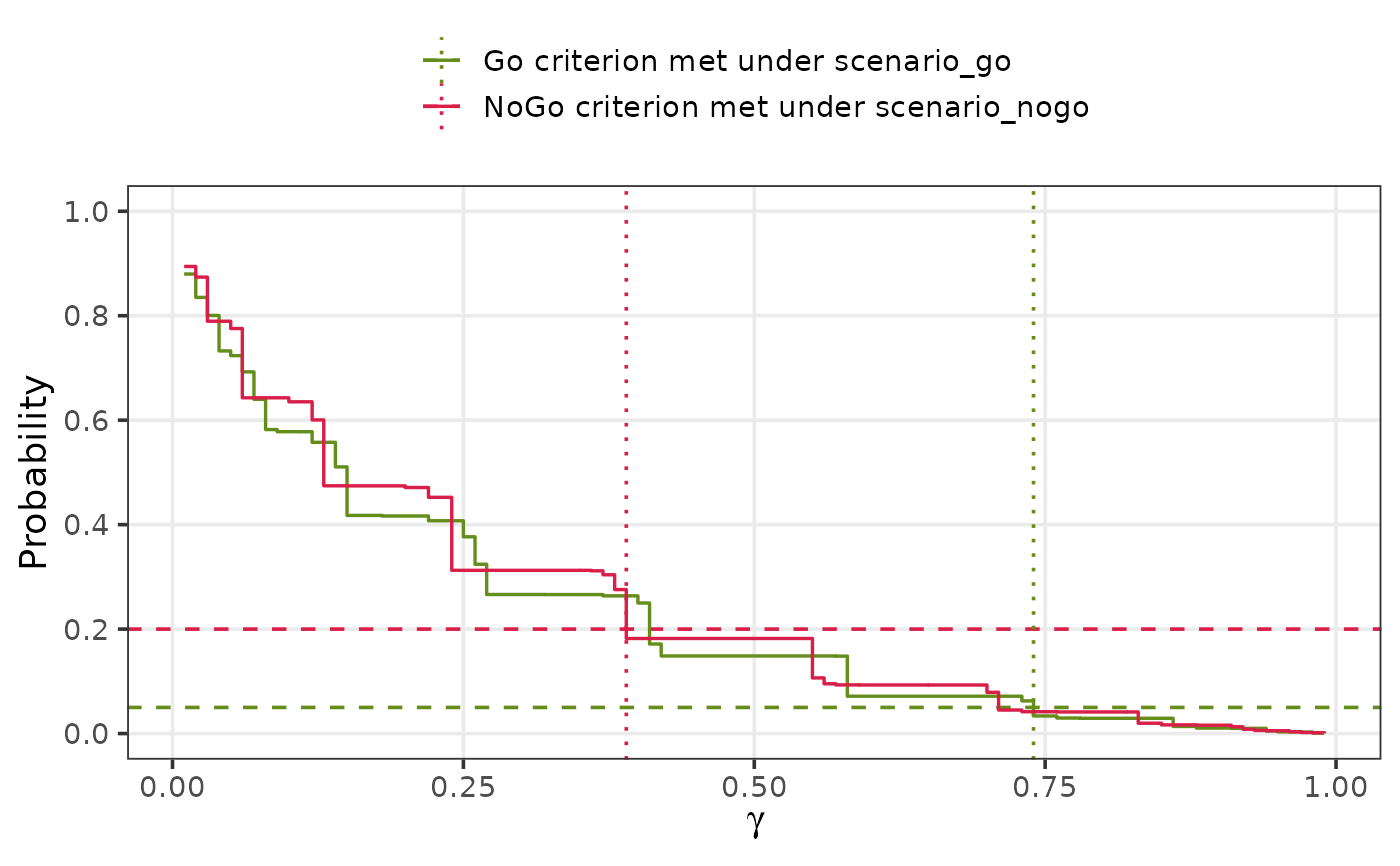
Draws the probability that the Go criterion is met under
scenario_go and the probability that the NoGo criterion is met under
scenario_nogo against the threshold, with the targets (horizontal
lines) and the chosen thresholds (vertical lines).
Usage
# S3 method for class 'qdm_calibration'
plot(
  x,
  col_go = "#658D1B",
  col_nogo = "#D91E49",
  linewidth = 1,
  base_size = 11,
  legend_position = "bottom",
  ...
)
Arguments
- x
An object of class
"qdm_calibration".- col_go, col_nogo
Colors of the curves, targets and thresholds of the Go and NoGo criteria: color names or hexadecimal codes. The defaults are green and red.
- linewidth
Width of the calibration curves, in the units of the
linewidthaesthetic of ggplot2.- base_size
Base font size of
ggplot2::theme_bw(), in points, which sets the size of the axis labels, tick labels and legend.- legend_position
Position of the legend:
"bottom"(the default),"top","left","right"or"none". To place the legend inside the plot, addggplot2::theme().- ...
Not used; arguments given here are ignored with a warning.
Details
The plot is a ggplot object, so it can be changed further by adding
ggplot2 functions, for example ggplot2::labs() and
ggplot2::theme().
Examples
des <- design_binary(
n_t = 12, n_c = 12,
prior_t = prior_beta(0.5, 0.5), prior_c = prior_beta(0.5, 0.5),
criterion = criterion_posterior(theta_tv = 0.2, theta_mav = 0.1,
gamma_go = 0.5, gamma_nogo = 0.8)
)
cal <- qdm_calibrate(des, data.frame(pi_t = 0.4, pi_c = 0.4),
data.frame(pi_t = 0.7, pi_c = 0.4),
target_go = 0.05, target_nogo = 0.2)
plot(cal)
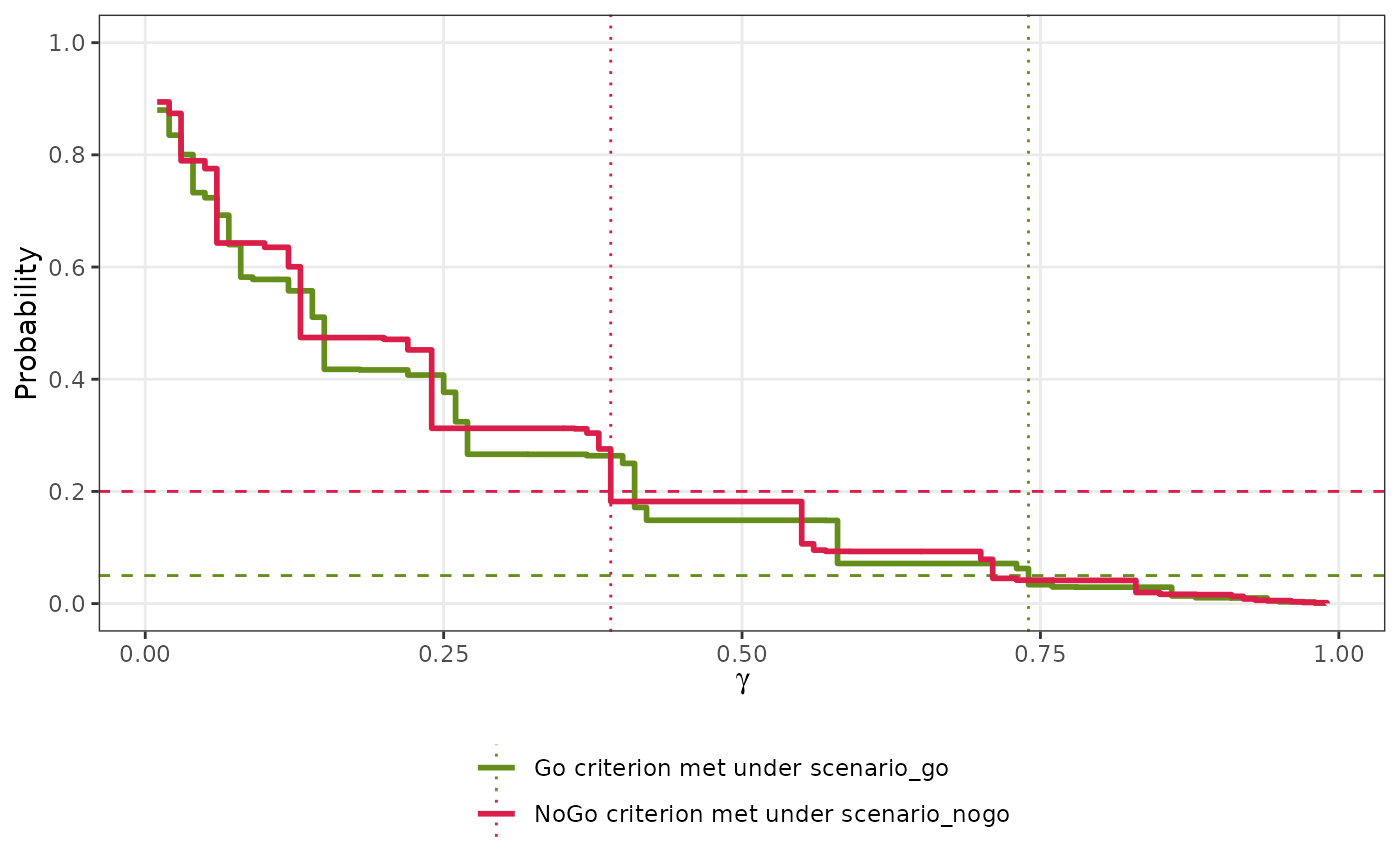 plot(cal, linewidth = 0.6, base_size = 14, legend_position = "top")