This vignette describes the analysis of a proof-of-concept (PoC)
study with one time-to-event endpoint, such as progression-free
survival, evaluated by the survival probability at a milestone time or
by the hazard ratio. vignette("overview") introduces the
decision criteria.
Model
In group
(),
the event times are exponential with hazard
,
and the data are summarized by the number of events
and the total observed time
,
the sum of the follow-up times of all subjects until their event or
censoring (data_tte()). With the Gamma prior
(shape
and rate
;
prior_gamma()), the posterior distribution is
The prior acts as
events in a total observed time of
,
so a prior with a small shape and rate, such as
prior_gamma(0.1, 1) with time in months, has little
influence.
The effect is the difference of the survival probabilities at the
milestone time
,
The posterior probability
is computed by numerical integration over the control hazard
(psurvdiff()).
Alternatively, the effect is the hazard ratio
(effect = "hazard_ratio"; Huang et al., 2019). With the
posterior shapes
and rates
,
its posterior distribution is a scaled F distribution,
so its posterior
probabilities are computed exactly (phazardratio()).
External data with events and total observed time enter through a power prior with weight , which adds to the shape and to the rate. A hypothetical control adds its events and total observed time to the prior of the control group.
Decision for observed data
A single-arm study is often compared with a known benchmark. With
fixed_c, the control survival probability at the milestone
is a known value
,
and the probabilities of the Go and NoGo regions are Gamma probabilities
of the treatment hazard. Consider 30 subjects, a milestone of 3 months,
a benchmark of 0.72,
and
:
crit <- criterion_posterior(theta_tv = 0.15, theta_mav = 0,
                            gamma_go = 0.6, gamma_nogo = 0.8)
des <- design_tte(n_t = 30, n_c = 0, prior_t = prior_gamma(0.1, 1),
                  criterion = crit, milestone = 3, fixed_c = 0.72)
dec <- qdm_decide(des, data_t = data_tte(events = 6, exposure = 150))
dec
#> Decision: Go
#>   Go:   P(theta > 0.15 | data) = 0.6863 (threshold 0.6, met)
#>   NoGo: P(theta <= 0 | data) = 0.001061 (threshold 0.8, not met)
#> Posterior distributions
#>   Treatment: hazard ~ Gamma(shape = 6.1, rate = 151)
#>   Control:   fixed value 0.72
The Go region is , that is , whose posterior probability is
With fixed_c = 0, the effect is the milestone survival
probability itself, and the thresholds are survival probabilities.
With a concurrent control group of 30 subjects:
des_c <- design_tte(n_t = 30, n_c = 30, prior_t = prior_gamma(0.1, 1),
                    prior_c = prior_gamma(0.1, 1), criterion = crit,
                    milestone = 3)
dec_c <- qdm_decide(des_c, data_t = data_tte(6, 150),
                    data_c = data_tte(12, 140))
dec_c
#> Decision: Gray
#>   Go:   P(theta > 0.15 | data) = 0.2906 (threshold 0.6, not met)
#>   NoGo: P(theta <= 0 | data) = 0.05513 (threshold 0.8, not met)
#> Posterior distributions
#>   Treatment: hazard ~ Gamma(shape = 6.1, rate = 151)
#>   Control:   hazard ~ Gamma(shape = 12.1, rate = 141)
post_t <- dec_c$posterior_t
post_c <- dec_c$posterior_c
psurvdiff(0.15, milestone = 3, shape_t = post_t[["shape"]],
          rate_t = post_t[["rate"]], shape_c = post_c[["shape"]],
          rate_c = post_c[["rate"]], lower.tail = FALSE)
#> [1] 0.2905515
External control data and hypothetical controls are given as in the
other vignettes, with borrow(data_tte(...), a0) and
hypothetical(data_tte(...)).
Conduct of the study
The operating characteristics and the predictive criterion need the
timing of the study, which conduct_tte() specifies: the
enrollment (piecewise uniform over the intervals of
accrual_time with relative rates
accrual_rate), the dropout (piecewise exponential hazards)
and the time of the analysis, either at a calendar time
(cut_time) or at the time of a given number of events among
all subjects of the study (cut_events). For example,
enrollment over 15 months with increasing rates, a small dropout hazard
and an analysis 15.44 months after the start of enrollment:
cond <- conduct_tte(accrual_time = c(0, 5, 10, 15),
                    accrual_rate = c(0.4, 2, 4.5),
                    dropout_hazard = 0.00226, cut_time = 15.44)
cond
#> Enrollment: piecewise uniform on (0, 5, 10, 15) with rates (0.4, 2.0, 4.5)
#> Dropout: hazard 0.00226
#> Analysis: at time 15.44
des <- design_tte(n_t = 30, n_c = 0, prior_t = prior_gamma(0.1, 1),
                  criterion = crit, milestone = 3, conduct = cond,
                  fixed_c = 0.72)
Predictive criterion
For the predictive criterion, a future study with
and
subjects is conducted as specified by conduct_future (by
default conduct). The survival probability of each group in
the future study is estimated by
,
from its number of events
and total observed time
,
and the future effect is the difference of the two estimates (or the
treatment estimate minus the fixed value). The predictive probabilities
are estimated by simulating nMC future studies, each with
hazards drawn from the posterior distributions, so they are Monte Carlo
estimates and depend on the seed:
des_pred <- design_tte(
  n_t = 30, n_c = 0, prior_t = prior_gamma(0.1, 1),
  criterion = criterion_predictive(theta_null = 0.05, m_t = 60,
                                   gamma_go = 0.8, gamma_nogo = 0.3),
  milestone = 3, conduct = cond, fixed_c = 0.72, nMC = 5000
)
qdm_decide(des_pred, data_t = data_tte(6, 150), seed = 1)
#> Decision: Go
#>   Go:   P(future theta > 0.05 | data) = 0.9682 (threshold 0.8, met)
#>   NoGo: P(future theta <= 0.05 | data) = 0.0318 (threshold 0.3, not met)
#> Posterior distributions
#>   Treatment: hazard ~ Gamma(shape = 6.1, rate = 151)
#>   Control:   fixed value 0.72
Operating characteristics
A scenario gives the median survival time of each group
(median_t and, with a concurrent control group,
median_c), and the hazard is
divided by the median. qdm_oc() simulates nsim
studies conducted as specified by conduct, with the same
random numbers for all scenarios. The median for which the milestone
survival equals the benchmark is med0 below, and the median
for which it equals the benchmark plus
is med1:
med0 <- 3 * log(2) / -log(0.72)
med1 <- 3 * log(2) / -log(0.72 + 0.15)
c(med0, med1)
#> [1]  6.330033 14.931859
scen <- data.frame(median_t = c(6, 8, 10, 12, 15, 20))
oc <- qdm_oc(des, scen, seed = 1)
oc
#> Operating characteristics (simulation of 10000 studies; probabilities by exact computation (fixed control))
#>  median_t     Go   NoGo   Gray Miss
#>         6 0.0035 0.2252 0.7713    0
#>         8 0.0384 0.0435 0.9181    0
#>        10 0.1284 0.0083 0.8633    0
#>        12 0.2671 0.0018 0.7311    0
#>        15 0.4681 0.0002 0.5317    0
#>        20 0.7152 0.0000 0.2848    0
plot(oc)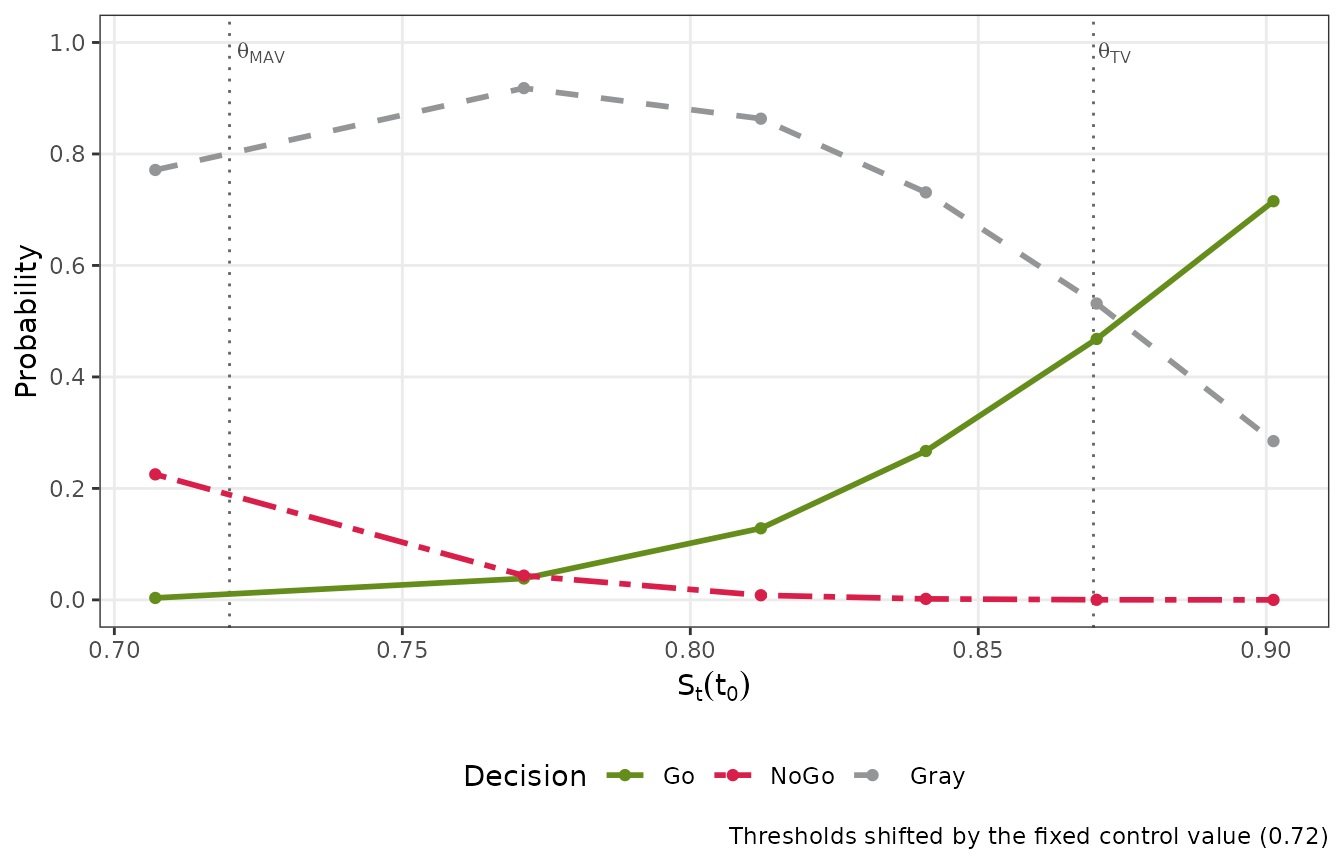
The horizontal axis is the survival probability of the treatment group at the milestone, and the vertical lines are shifted by the fixed control value. For a design with a concurrent control group, the probabilities of each simulated study are computed by numerical integration, which takes longer; here 1000 studies are simulated per scenario:
des_c <- design_tte(n_t = 30, n_c = 30, prior_t = prior_gamma(0.1, 1),
                    prior_c = prior_gamma(0.1, 1), criterion = crit,
                    milestone = 3, conduct = cond)
oc_c <- qdm_oc(des_c, data.frame(median_t = c(med0, 10, 15, 20),
                                 median_c = med0), nsim = 1000, seed = 1)
oc_c
#> Operating characteristics (simulation of 1000 studies; probabilities by numerical integration)
#>  median_t median_c    Go  NoGo  Gray Miss
#>      6.33     6.33 0.033 0.193 0.774    0
#>     10.00     6.33 0.183 0.033 0.784    0
#>     15.00     6.33 0.389 0.002 0.609    0
#>     20.00     6.33 0.530 0.002 0.468    0
With a predictive criterion, every simulated study requires
nMC simulated future studies, so small values of
nsim and nMC are advisable for
exploration.
Calibration of the thresholds
The thresholds of the single-arm design are calibrated so that the Go
criterion is met with probability at most 0.05 when the milestone
survival equals the benchmark (median med0), and the NoGo
criterion with probability at most 0.1 when it equals the benchmark plus
0.15 (median med1):
cal <- qdm_calibrate(des, scenario_go = data.frame(median_t = med0),
                     scenario_nogo = data.frame(median_t = med1),
                     target_go = 0.05, target_nogo = 0.1, seed = 1)
cal
#> Calibration of the decision thresholds (simulation of 10000 studies; probabilities by exact computation (fixed control))
#>   gamma_go   = 0.24: P(Go criterion met | scenario_go) = 0.0489 (target 0.05)
#>   gamma_nogo = 0.1: P(NoGo criterion met | scenario_nogo) = 0.0928 (target 0.1)
#> Decision probabilities with the chosen thresholds
#>       scenario median_t     Go   NoGo   Gray Miss
#>    scenario_go     6.33 0.0489 0.8815 0.0696    0
#>  scenario_nogo    14.93 0.7995 0.0928 0.1077    0
plot(cal)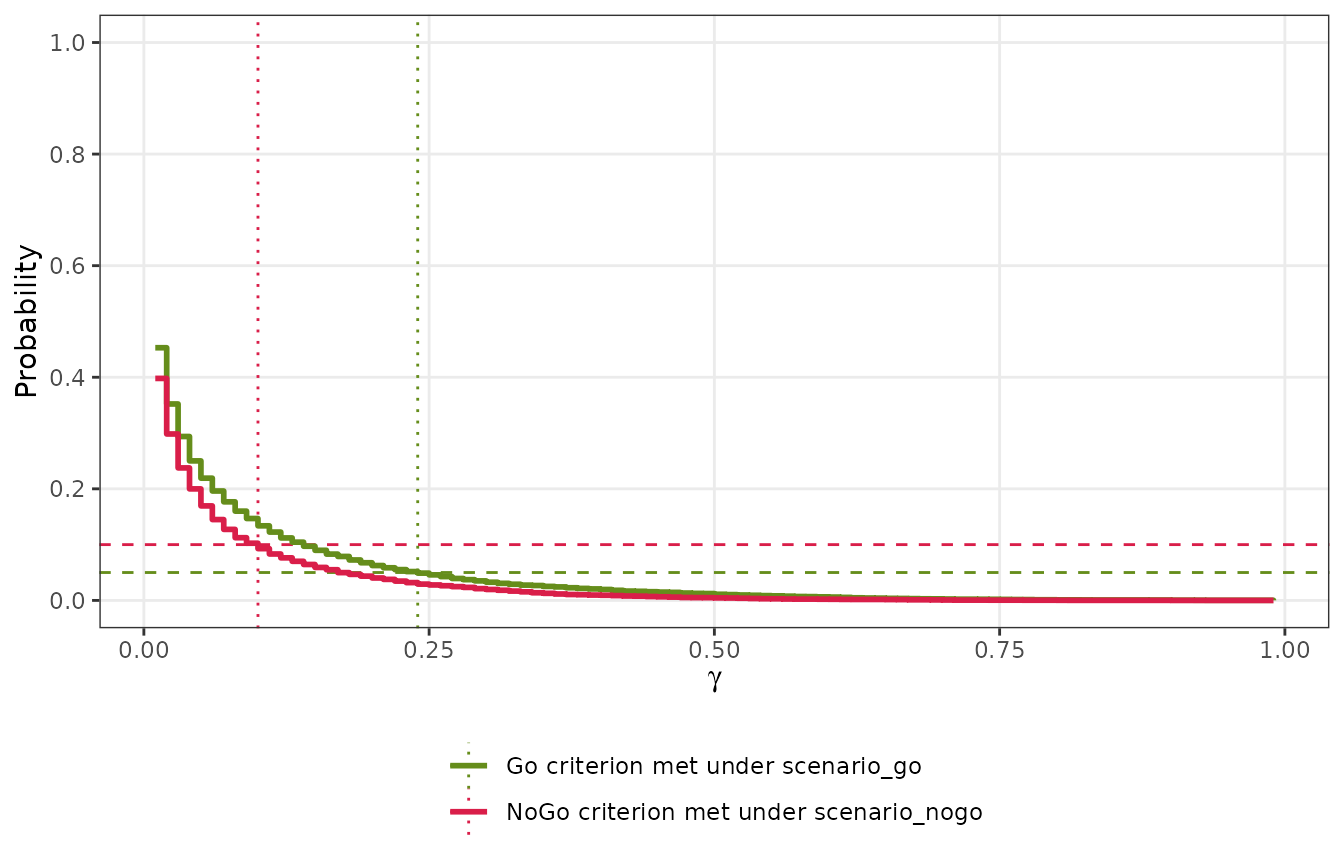
The chosen thresholds are 0.24 and 0.1.
Decision boundary
qdm_boundary() gives, for each total observed time of
the treatment group, the numbers of events that lead to Go, NoGo and
Gray decisions, with the corresponding observed milestone survival
probabilities
and observed effects. With a posterior criterion, it does not depend on
the conduct of the study:
b <- qdm_boundary(des, exposure_t = seq(100, 300, by = 50))
b
#> Decision boundary of a design with one time-to-event endpoint (milestone survival)
#>
#> Events in the treatment group (d_t)
#>   exposure_t   Go     Gray    NoGo
#>   100          0-4    5-14    15-30
#>   150          0-6    7-20    21-30
#>   200          0-8    9-26    27-30
#>   250          0-11   12-30   -
#>   300          0-13   14-30   -
#>
#> Observed milestone survival exp(-3 d_t / E_t)
#>   exposure_t   Go            Gray               NoGo
#>   100          0.8869 to 1   0.657 to 0.8607    0.4066 to 0.6376
#>   150          0.8869 to 1   0.6703 to 0.8694   0.5488 to 0.657
#>   200          0.8869 to 1   0.6771 to 0.8737   0.6376 to 0.667
#>   250          0.8763 to 1   0.6977 to 0.8659   -
#>   300          0.8781 to 1   0.7408 to 0.8694   -
#>
#> Observed difference in milestone survival (control 0.72, fixed control value)
#>   exposure_t   Go               Gray                 NoGo
#>   100          0.1669 to 0.28   -0.06295 to 0.1407   -0.3134 to -0.08237
#>   150          0.1669 to 0.28   -0.04968 to 0.1494   -0.1712 to -0.06295
#>   200          0.1669 to 0.28   -0.04294 to 0.1537   -0.08237 to -0.05302
#>   250          0.1563 to 0.28   -0.02232 to 0.1459   -
#>   300          0.1581 to 0.28   0.02082 to 0.1494    -
With a total observed time of 150 months, a Go decision needs at most 6 events. The plot shows the regions of the decisions over many values of the total observed time:
plot(qdm_boundary(des, exposure_t = seq(20, 400, by = 5)))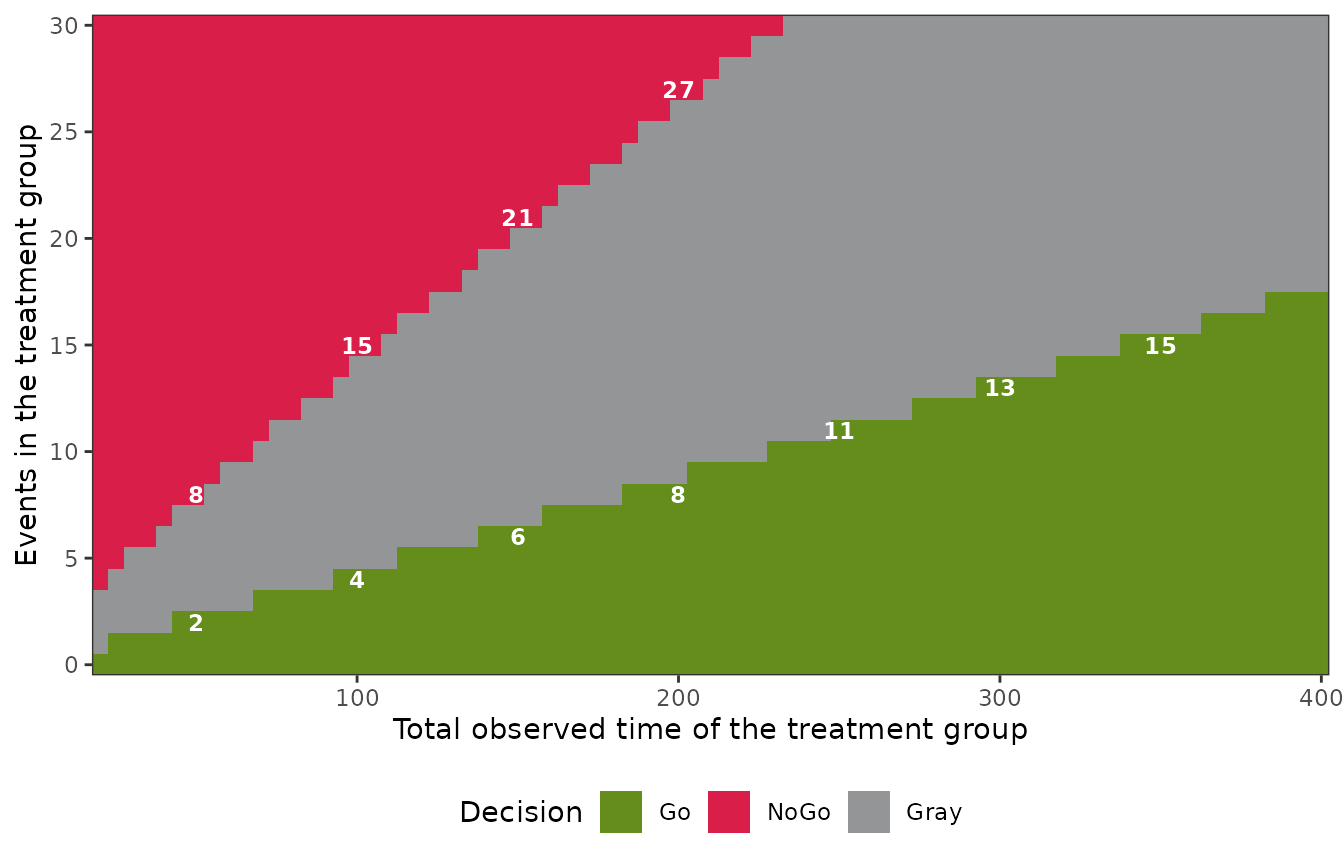
For a design with a concurrent control group, the observed control
data are given by data_c.
Hazard ratio
With effect = "hazard_ratio", smaller effects are
favorable, so the criterion is specified with
direction = "less": the Go region is
and the NoGo region is
,
with
.
The example of Huang et al. (2019) is a randomized study with 112
subjects in the treatment group and 56 in the control group, uniform
enrollment over 13 months, a control median survival time of 8.5 months,
a loss-to-follow-up hazard of 0.003 per month, a target value of 0.67
and a minimum acceptable value of 0.8 for the hazard ratio, and an
analysis at 127 events. Huang et al. (2019) use the minimum acceptable
value in their Go rule, as a bound for the upper confidence limit of the
hazard ratio. Here the decision is Go if the hazard ratio is below 0.67
with probability at least 0.5, and NoGo if it is at least 0.8 with
probability at least 0.6:
crit_hr <- criterion_posterior(theta_tv = 0.67, theta_mav = 0.8,
                               gamma_go = 0.5, gamma_nogo = 0.6,
                               direction = "less")
des_hr <- design_tte(
  n_t = 112, n_c = 56, prior_t = prior_gamma(0.01, 0.01),
  prior_c = prior_gamma(0.01, 0.01), criterion = crit_hr,
  effect = "hazard_ratio",
  conduct = conduct_tte(accrual_time = c(0, 13), dropout_hazard = 0.003,
                        cut_events = 127)
)
dec_hr <- qdm_decide(des_hr, data_t = data_tte(75, 1100),
                     data_c = data_tte(52, 420))
dec_hr
#> Decision: Go
#>   Go:   P(theta < 0.67 | data) = 0.8569 (threshold 0.5, met)
#>   NoGo: P(theta >= 0.8 | data) = 0.02137 (threshold 0.6, not met)
#> Posterior distributions
#>   Treatment: hazard ~ Gamma(shape = 75.01, rate = 1100)
#>   Control:   hazard ~ Gamma(shape = 52.01, rate = 420)
post_t <- dec_hr$posterior_t
post_c <- dec_hr$posterior_c
phazardratio(0.67, shape_t = post_t[["shape"]], rate_t = post_t[["rate"]],
             shape_c = post_c[["shape"]], rate_c = post_c[["rate"]])
#> [1] 0.8569464
The argument milestone is not used and must not be
given. Under the exponential model, the hazard ratio is the ratio of the
median survival times of the control and treatment groups, which is the
horizontal axis of the plot of operating characteristics:
oc_hr <- qdm_oc(des_hr, data.frame(median_t = 8.5 / c(0.5, 0.6, 0.7, 0.8, 1),
                                   median_c = 8.5), seed = 1)
oc_hr
#> Operating characteristics (simulation of 10000 studies; probabilities by exact computation (F distribution))
#>  median_t median_c     Go   NoGo   Gray Miss
#>     17.00      8.5 0.9433 0.0017 0.0550    0
#>     14.17      8.5 0.7204 0.0358 0.2438    0
#>     12.14      8.5 0.4108 0.1685 0.4207    0
#>     10.62      8.5 0.1702 0.3985 0.4313    0
#>      8.50      8.5 0.0176 0.8258 0.1566    0
plot(oc_hr)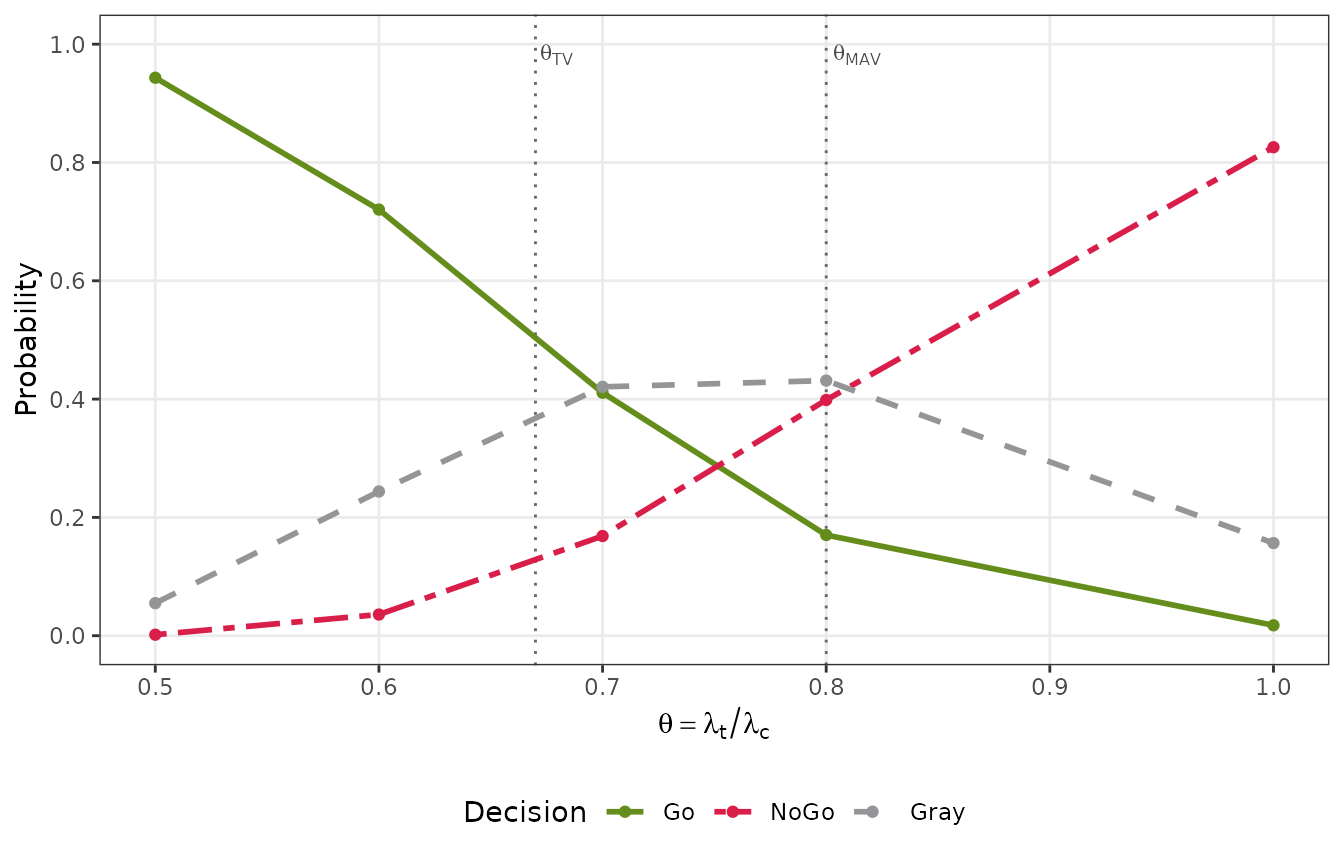
The probabilities of a Go decision are close to those of Table 1 of
Huang et al. (2019), which are based on the normal approximation of the
estimated log hazard ratio (0.946, 0.727, 0.406 and 0.170 for hazard
ratios of 0.5, 0.6, 0.7 and 0.8). The decision boundary gives the
numbers of treatment events that lead to each decision for given total
observed times of the treatment group and given control data
(data_c), with the observed hazard ratios
:
qdm_boundary(des_hr, exposure_t = seq(800, 1400, by = 200),
             data_c = data_tte(52, 420))
#> Decision boundary of a design with one time-to-event endpoint (hazard ratio)
#>   Control data: time-to-event, events = 52, exposure = 420
#>
#> Events in the treatment group (d_t)
#>   exposure_t   Go      Gray      NoGo
#>   800          0-66    67-82     83-112
#>   1000         0-82    83-103    104-112
#>   1200         0-99    100-112   -
#>   1400         0-112   -         -
#>
#> Observed hazard ratio: d_t / E_t divided by the control hazard 0.1238 (observed in the control group)
#>   exposure_t   Go            Gray               NoGo
#>   800          0 to 0.6663   0.6764 to 0.8279   0.838 to 1.131
#>   1000         0 to 0.6623   0.6704 to 0.8319   0.84 to 0.9046
#>   1200         0 to 0.6663   0.6731 to 0.7538   -
#>   1400         0 to 0.6462   -                  -
For a single-arm study, fixed_c is the median survival
time of the control, whose hazard is
divided by it. For the predictive criterion, the hazard of each group in
the future study is estimated by
,
the future effect is the ratio of the two estimates, and with
direction = "less" the Go region is that it is below
.
Reference
Huang, B., Talukder, E., Han, L. and Kuan, P.-F. (2019). Quantitative decision-making in randomized Phase II studies with a time-to-event endpoint. Journal of Biopharmaceutical Statistics, 29(1), 189–202. https://doi.org/10.1080/10543406.2018.1489400