
Plot the Power of a BSSR Design against the Fixed-Sample Design
Source:R/plot.bbssr_powerbssr.R
plot.bbssr_powerbssr.RdPlot the Power of a BSSR Design against the Fixed-Sample Design
Usage
# S3 method for class 'bbssr_powerbssr'
plot(
  x,
  main = NULL,
  sub = NULL,
  xlab = NULL,
  ylab = NULL,
  ylim = NULL,
  ref.line = NULL,
  legend.title = NULL,
  legend.labels = NULL,
  show.points = TRUE,
  colours = NULL,
  base_size = 11,
  ...
)
Arguments
- x
An object of class
bbssr_powerbssrreturned byBinaryPowerBSSR- main
Title of the plot. The default of
NULLbuilds the title from the object and a singleNAdrops it- sub
Subtitle of the plot, following the convention of
main- xlab
Label of the horizontal axis, following the convention of
main- ylab
Label of the vertical axis, following the convention of
main- ylim
Numeric vector of length two giving the range of the vertical axis, or
NULLfor a range chosen from the data- ref.line
Numeric vector of heights at which a dashed horizontal line is drawn. The default of
NULLplaces one line at the target power and a singleNAdraws no line- legend.title
Title of the legend. The default of
NULLleaves the legend untitled- legend.labels
Character vector of length two replacing the entries of the legend, in the order BSSR then fixed sample
- show.points
Logical. If
TRUE, the default, a marker is drawn at every evaluated pooled probability. Set it toFALSEto draw the curves alone, which is easier to read on a fine grid- colours
Character vector of length two giving the colour of the two curves, in the order BSSR then fixed sample
- base_size
Base font size of the theme, in points
- ...
Further arguments, currently ignored
Details
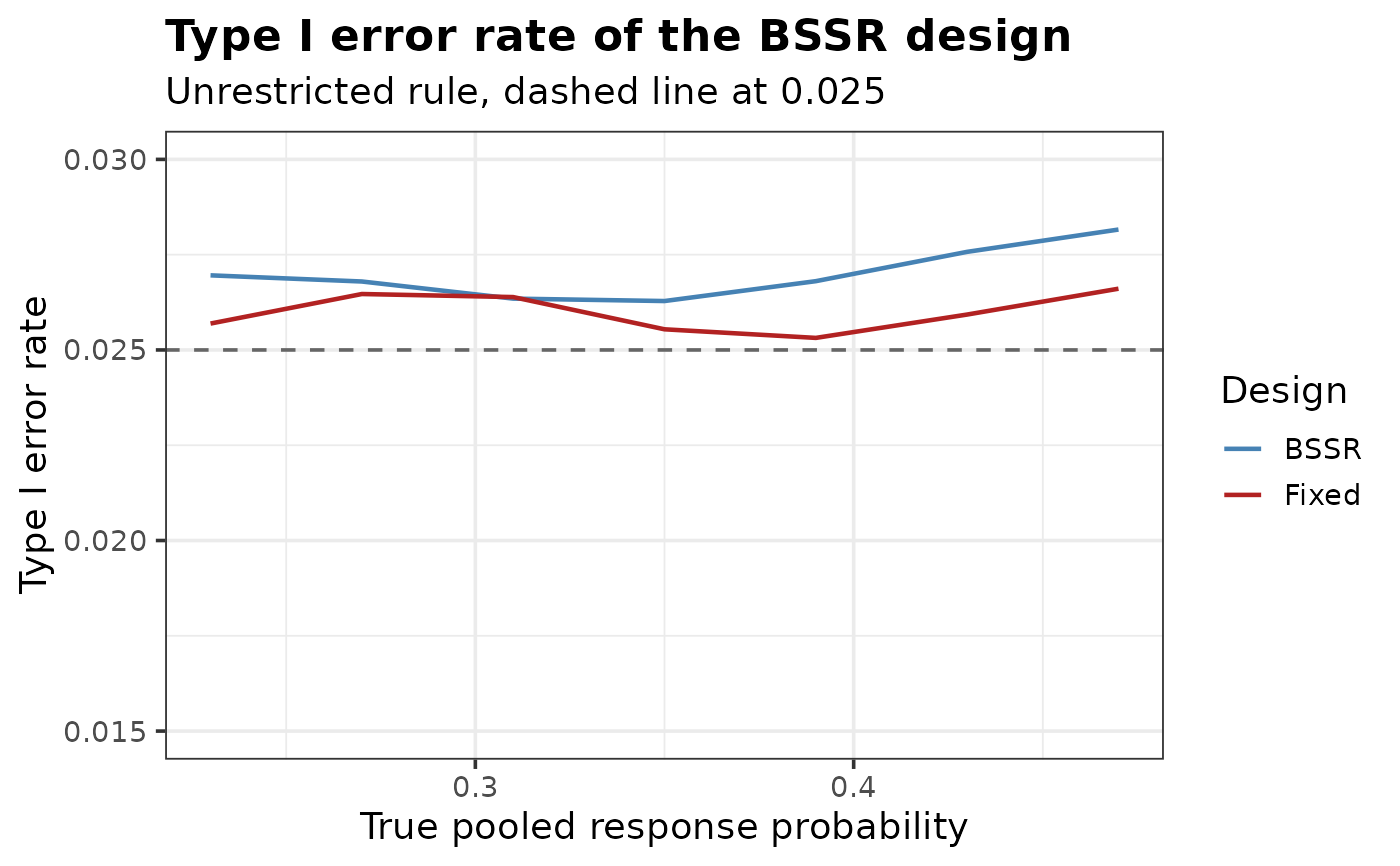
Setting Delta.T to 0 in BinaryPowerBSSR turns the two power columns
into rejection probabilities under the null hypothesis. The default reference line at
the target power is then out of place, and the level of significance passed through
ref.line together with a rescaled ylim gives a readable plot of the type I
error rate.
The vertical range is imposed with coord_cartesian, so points
outside ylim are hidden rather than removed from the data.
Examples
# \donttest{
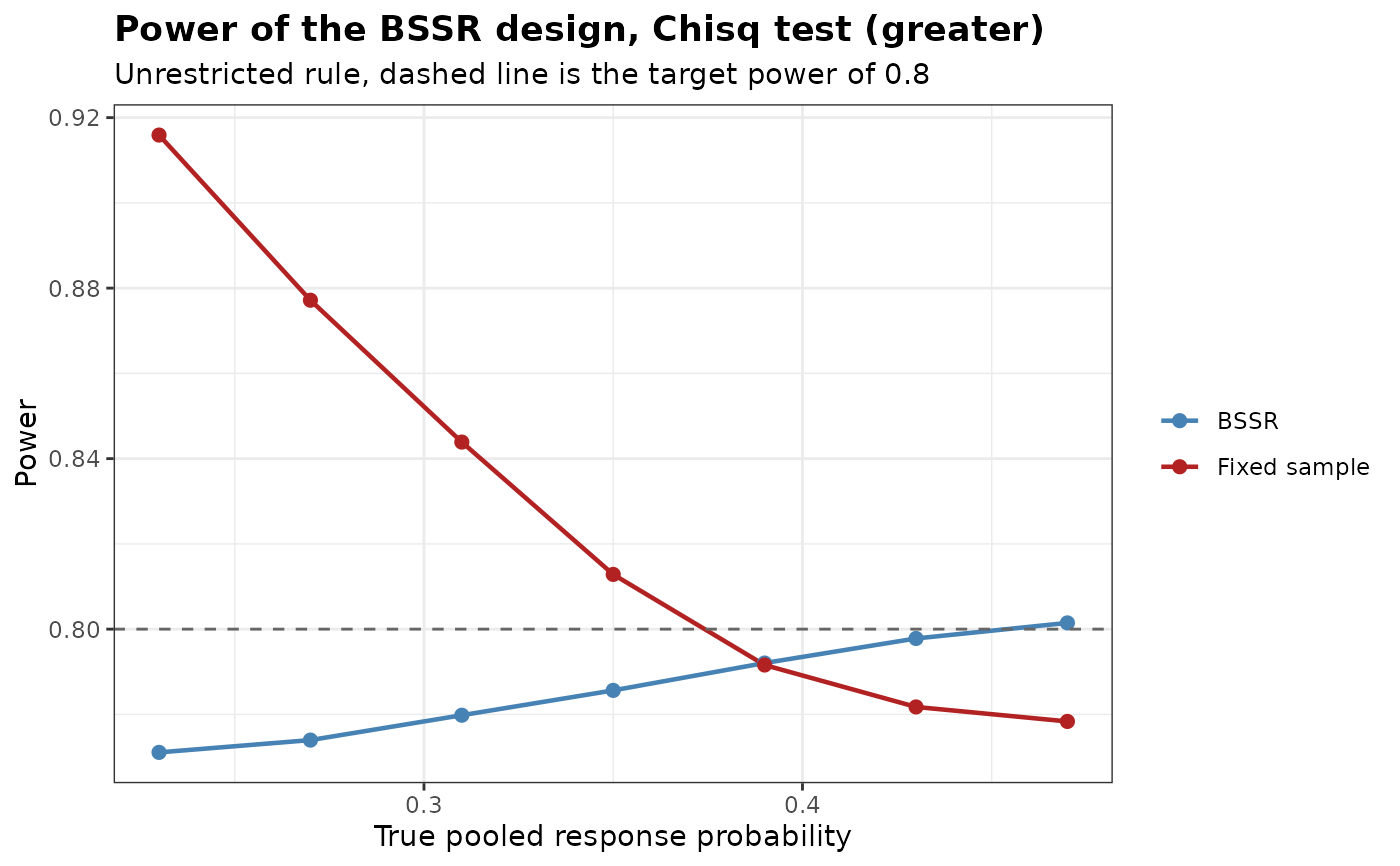
res <- BinaryPowerBSSR(
p = seq(0.23, 0.47, by = 0.04),
Delta.A = 0.3, Delta.T = 0.3,
N1 = 39, N2 = 39, omega = 0.5, r = 1,
alpha = 0.025, tar.power = 0.8, Test = 'Chisq'
)
plot(res)
 # Type I error rate, with the reference line moved to the level of significance
tie <- BinaryPowerBSSR(
p = seq(0.23, 0.47, by = 0.04),
Delta.A = 0.3, Delta.T = 0,
N1 = 39, N2 = 39, omega = 0.5, r = 1,
alpha = 0.025, tar.power = 0.8, Test = 'Chisq'
)
plot(tie, ref.line = 0.025, ylim = c(0.015, 0.030), base_size = 14,
show.points = FALSE,
main = 'Type I error rate of the BSSR design', ylab = 'Type I error rate',
legend.title = 'Design', legend.labels = c('BSSR', 'Fixed'))
 # }