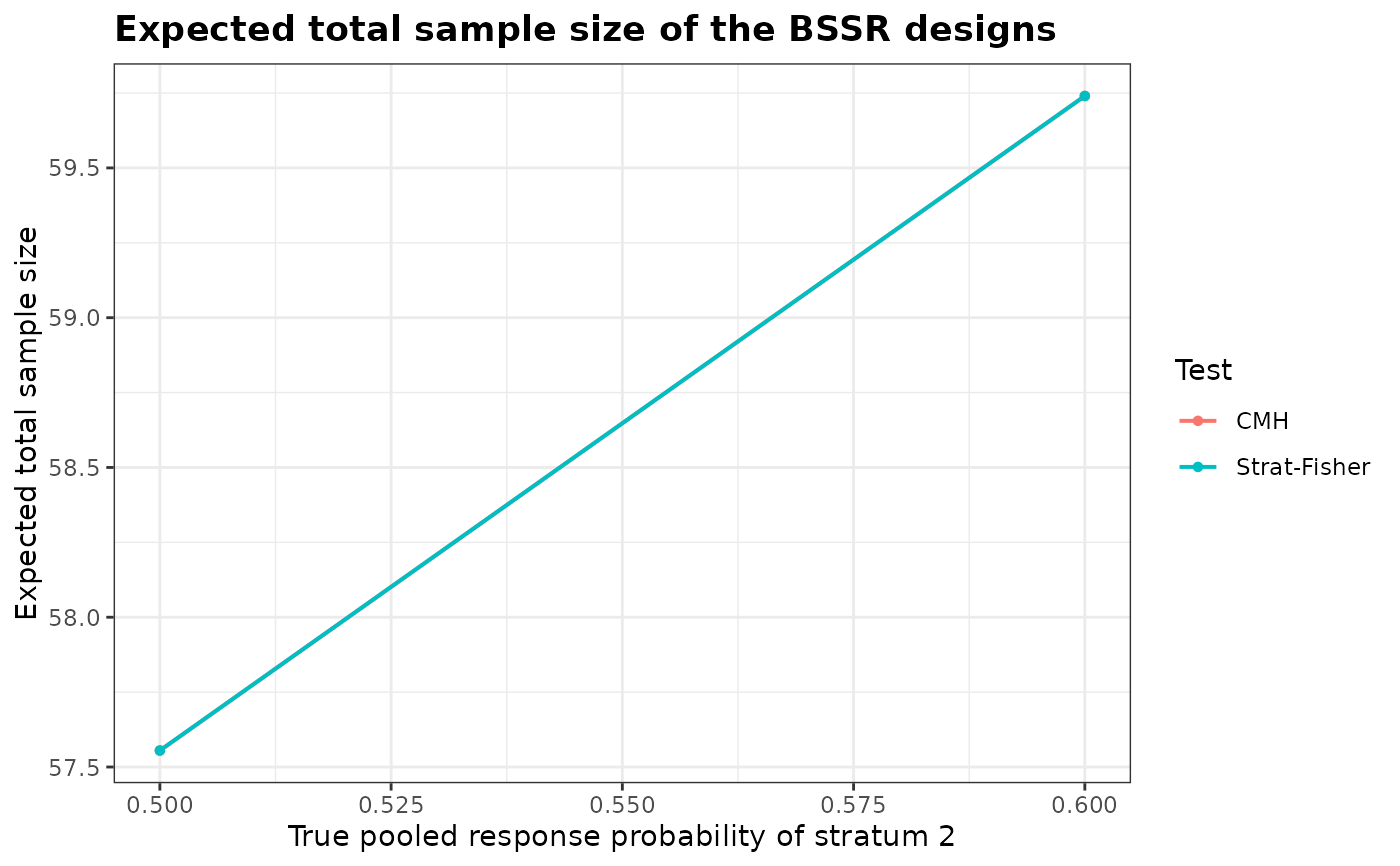
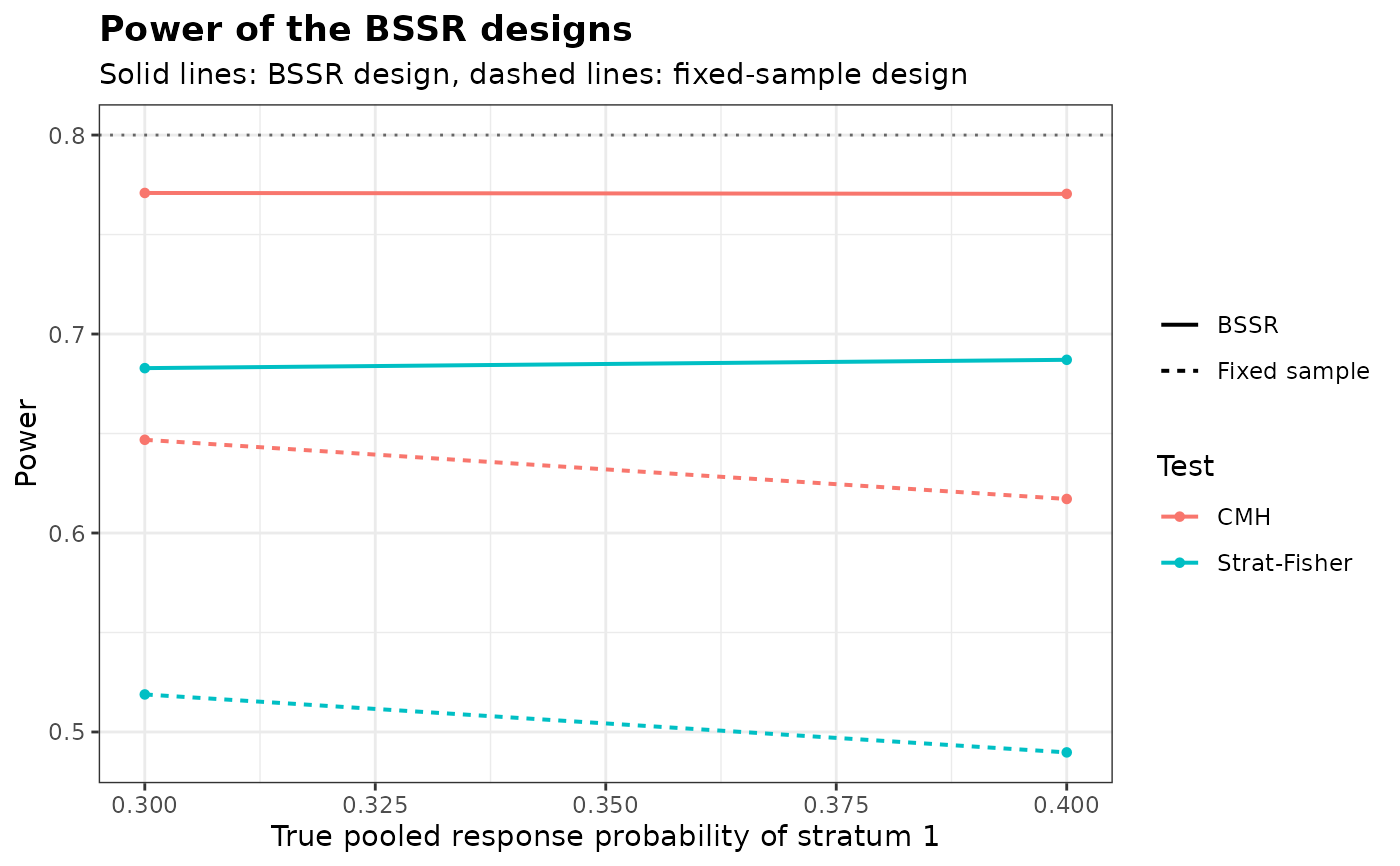
Draws the power or the expected total sample size of the stratified designs of
StratGridBSSR against a chosen column, with one colour per value of
another column and, optionally, one panel per value of a third, as
plot.bbssr_grid does for two groups.
Usage
# S3 method for class 'bbssr_sgrid'
plot(x, x.by = NULL, xlab = NULL, ...)
Arguments
- x
An object of class
bbssr_sgrid- x.by
Name of the numeric column of
xon the horizontal axis. The default ofNULLtakes the first of the true pooled response probabilitiesp.S1, p.S2, ...that varies between the scenarios, or the indexscenariowhen none varies- xlab
Label of the horizontal axis.
NULLmakes it fromx.by- ...
Further arguments of
plot.bbssr_grid:what,colour.by,facet.by,main,sub,ylab,ref.line,legend.titleandbase_size
Details
The lines join the scenarios of a design in the order of the horizontal axis, so the
scenarios should differ in a single probability, or x.by should name a column
in which they all differ; a warning is given when two scenarios of a design share a
value on the axis.
Examples
design <- data.frame(Test = c('CMH', 'Strat-Fisher'))
grid <- StratGridBSSR(design, p = rbind(c(0.3, 0.5), c(0.4, 0.6)), Delta.A = 0.3,
N1 = c(10, 10), N2 = c(10, 10), omega = 0.5, r = 1,
alpha = 0.05, tar.power = 0.8, ss.method = 'standard')
plot(grid, colour.by = 'Test')
 plot(grid, what = 'E.N', x.by = 'p.S2', colour.by = 'Test')