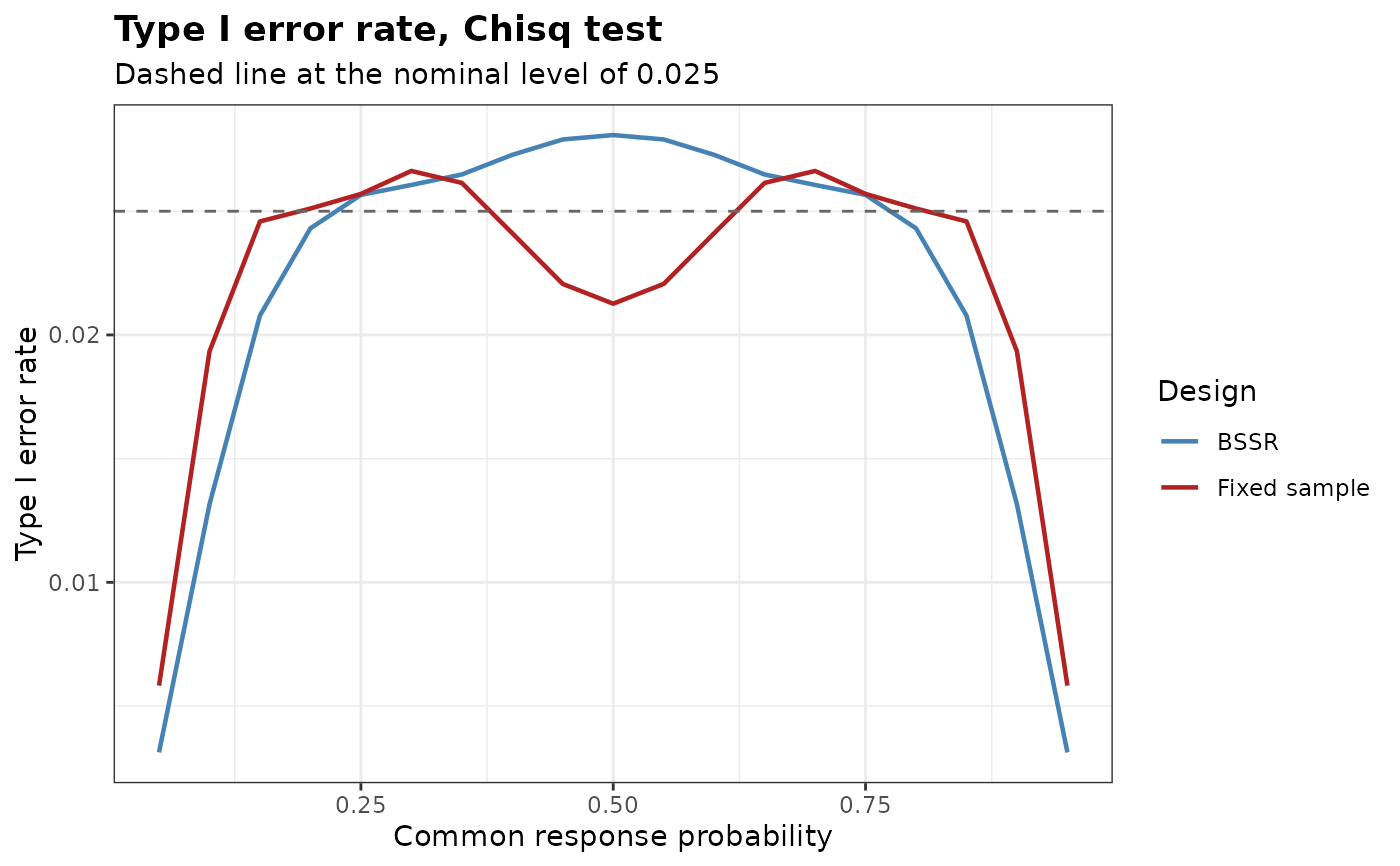
Draws the type I error rate of a design with blinded sample size re-estimation and of the corresponding fixed-sample design against the common response probability, with a reference line at the nominal level. For a test of equivalence the two boundaries of the null hypothesis are drawn in separate panels.
Usage
# S3 method for class 'bbssr_tie'
plot(
  x,
  main = NULL,
  sub = NULL,
  xlab = NULL,
  ylab = NULL,
  ylim = NULL,
  ref.line = NULL,
  legend.title = NULL,
  legend.labels = NULL,
  colours = NULL,
  base_size = 11,
  ...
)
Arguments
- x
An object of class
bbssr_tie- main
Title.
NULLkeeps the default andNAremoves it- sub
Subtitle.
NULLkeeps the default andNAremoves it- xlab
Label of the horizontal axis.
NULLkeeps the default- ylab
Label of the vertical axis.
NULLkeeps the default- ylim
Range of the vertical axis, applied through
coord_cartesian()- ref.line
Height of the dashed reference line.
NULLdraws it at the nominal level andNAremoves it- legend.title
Title of the legend.
NULLkeeps the default- legend.labels
Labels of the two designs.
NULLkeeps the defaults- colours
Two colours for the BSSR and the fixed-sample design
- base_size
Base font size passed to
theme_bw()- ...
Further arguments, ignored
Examples
tie <- BinaryTypeIErrorBSSR(
  Delta.A = 0.3, N1 = 20, N2 = 20, omega = 0.5, r = 1,
  alpha = 0.025, tar.power = 0.8, Test = 'Chisq', ss.method = 'standard',
  theta = seq(0.05, 0.95, by = 0.05)
)
plot(tie)