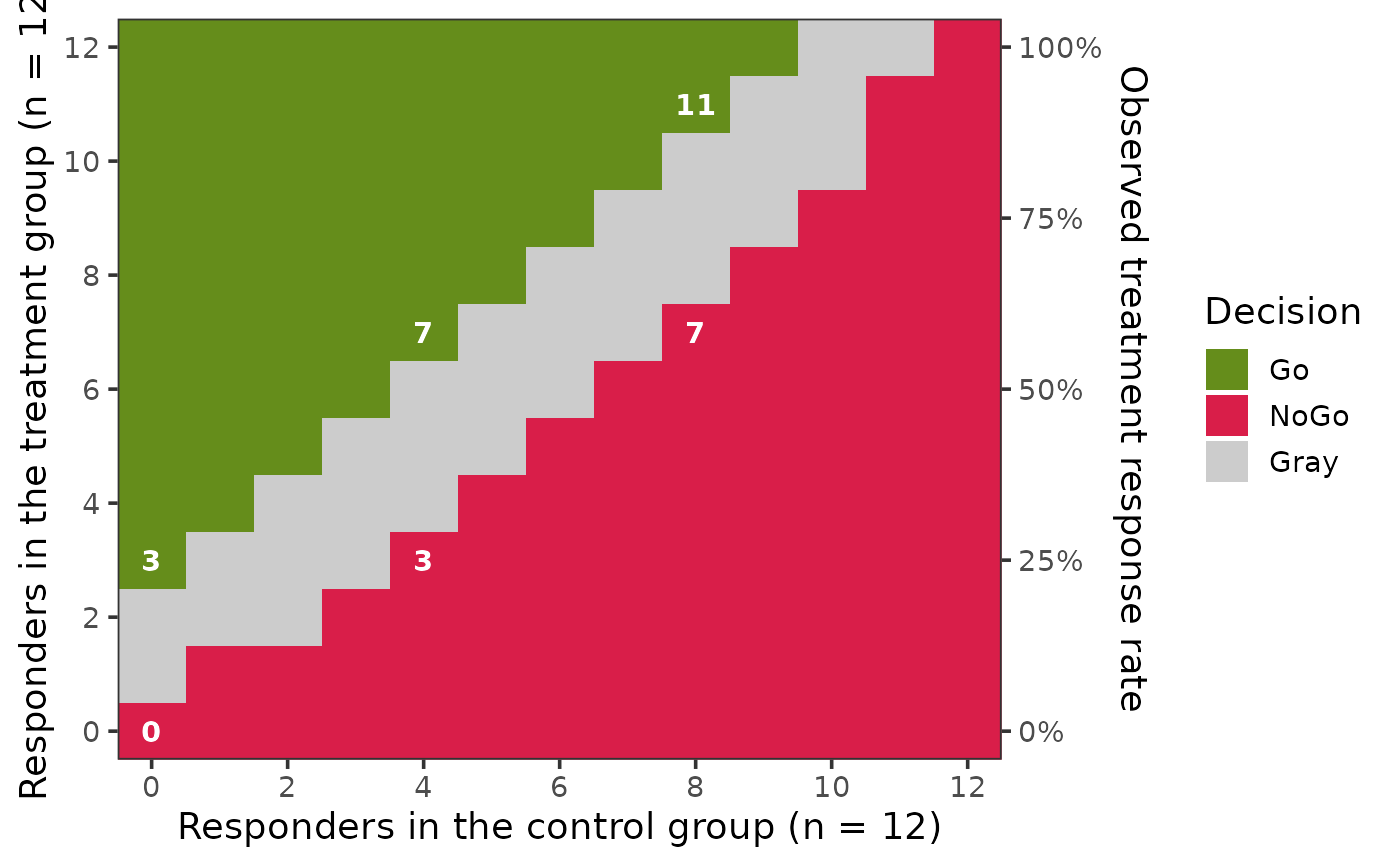
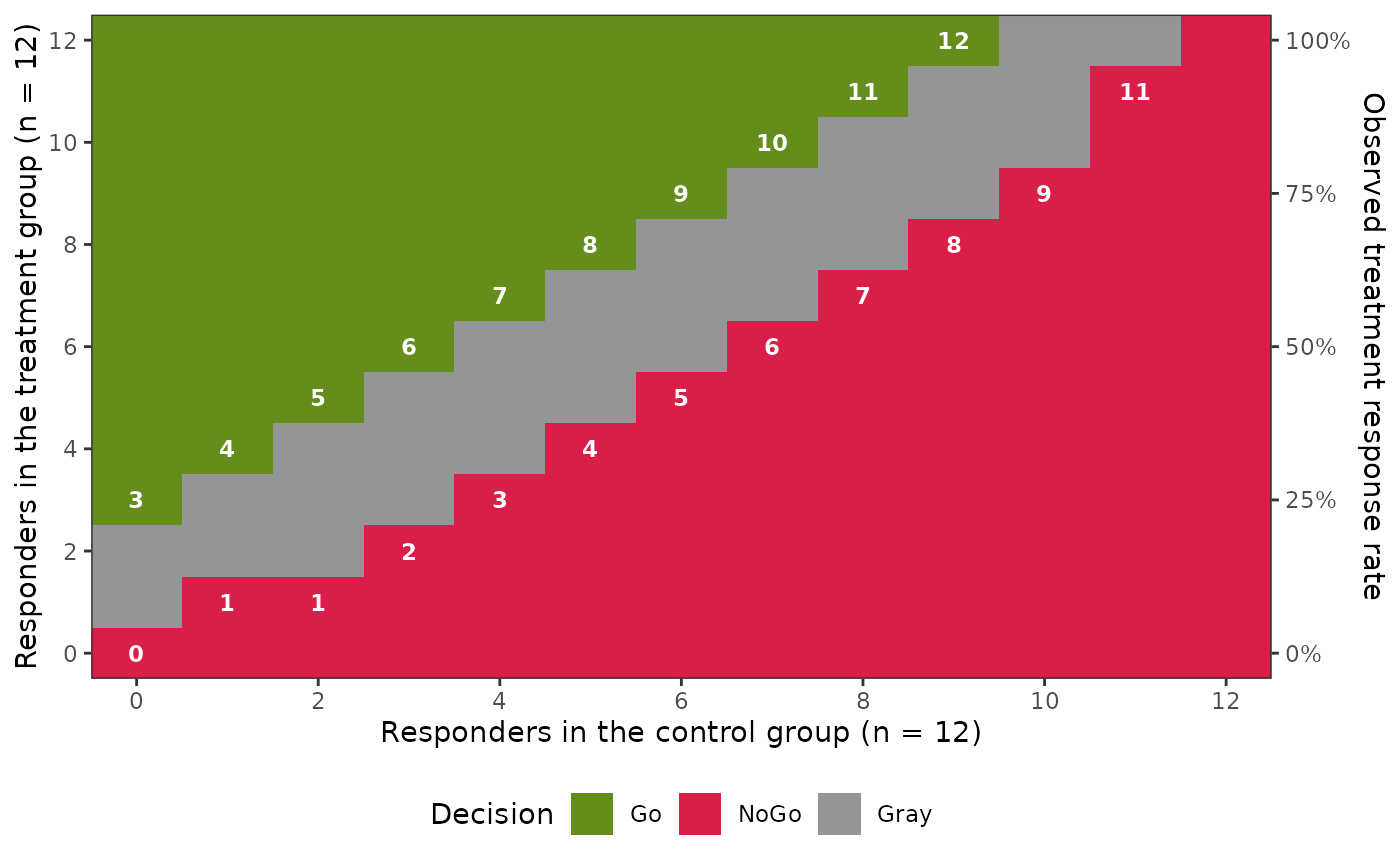
Draws the decision intervals computed by qdm_boundary as
regions filled by the decision (Go, NoGo, Gray, or Miss if it occurs):
the horizontal axis is the condition (for example, the number of control
responders or the treatment group size) and the vertical axis is the
observed quantity (numbers of responders or events, or the observed
treatment mean) or, for continuous endpoints with a concurrent control
group, the observed difference in means. The boundary values are
written on the Go and NoGo regions next to the boundaries, for example
the smallest number of responders that leads to a Go decision. With a
concurrent control group and a binary endpoint, the observed response
rate of the treatment group is shown on a secondary axis.
Usage
# S3 method for class 'qdm_boundary'
plot(
  x,
  col_go = "#658D1B",
  col_nogo = "#D91E49",
  col_gray = "#939597",
  col_miss = "#E69F00",
  labels = TRUE,
  label_size = NULL,
  base_size = 11,
  legend_position = "bottom",
  ...
)
Arguments
- x
An object of class
"qdm_boundary".- col_go, col_nogo, col_gray, col_miss
Colors of the Go, NoGo, Gray and Miss decisions: color names or hexadecimal codes. The defaults are green, red, gray and orange. Transparency (an alpha value in the code) is not used in the heat maps.
- labels
TRUE(the default) to write the boundary values for every value of the horizontal axis (or, with more than 16 values, for about six of them, leaving out the first and the last),FALSEfor none, or a numeric vector of the values of the horizontal axis at which they are written.- label_size
Size of the boundary values, in millimeters, or
NULLfor the size of the axis tick labels,0.8 * base_size / .pt.- base_size
Base font size of
ggplot2::theme_bw(), in points, which sets the size of the axis labels, tick labels, legend and caption.- legend_position
Position of the legend:
"bottom"(the default),"top","left","right"or"none". To place the legend inside the plot, addggplot2::theme().- ...
Not used; arguments given here are ignored with a warning.
Details
The plot is a ggplot object, so it can be changed further by adding
ggplot2 functions, for example ggplot2::labs(),
ggplot2::theme() and ggplot2::scale_fill_manual().
Examples
des <- design_binary(
n_t = 12, n_c = 12,
prior_t = prior_beta(0.5, 0.5), prior_c = prior_beta(0.5, 0.5),
criterion = criterion_posterior(theta_tv = 0.2, theta_mav = 0.1,
gamma_go = 0.5, gamma_nogo = 0.8)
)
b <- qdm_boundary(des)
plot(b)
 plot(b, labels = c(0, 4, 8), col_gray = "gray80", base_size = 14,
legend_position = "right")