Finds the observed data that lead to each decision (Go, NoGo, Gray, or
Miss) of a design: for example, how many responders out of \(n\) are
needed for a Go decision, or how large the observed difference in means
must be. Unlike the operating characteristics, the result does not depend
on the true parameters. It is a table of decision intervals of an
observed quantity (the numbers of responders or events, or an observed
mean), one set of intervals for each value of a second quantity (the
condition), together with the corresponding observed response rates,
milestone survival probabilities and treatment effects. The intervals are
printed as tables (print.qdm_boundary) and drawn as the
regions of the decisions with the boundary values written on them
(plot.qdm_boundary).
Usage
qdm_boundary(
  design,
  n_t = NULL,
  mean_t = NULL,
  sd_t = NULL,
  cov_t = NULL,
  events_t = NULL,
  exposure_t = NULL,
  data_c = NULL,
  seed = NULL
)
Arguments
- design
A design created by
design_binary,design_continuous,design_continuous2ordesign_tte.- n_t
Numbers of subjects in the treatment group (whole numbers); by default that of the design. Several values are allowed for one binary endpoint without a concurrent control group and for one continuous endpoint. For a time-to-event endpoint,
n_tonly sets the default numbers of events.- mean_t
For one continuous endpoint, an optional numeric vector: the grid of observed treatment means on which the boundary values are searched. For two continuous endpoints, a list of two numeric vectors: the observed treatment means of endpoint 1 (the conditions) and the grid of observed treatment means of endpoint 2.
- sd_t
Observed treatment standard deviations (one continuous endpoint; positive).
- cov_t
Observed treatment covariance matrix (two continuous endpoints; a 2 x 2 positive definite matrix).
- events_t
Numbers of events of the treatment group (time-to-event endpoint; whole numbers); by default
0:n_t.- exposure_t
Total observed times of the treatment group (time-to-event endpoint; positive).
- data_c
Observed data of the concurrent control group, created by
data_continuous,data_continuous2ordata_tte; required for those endpoints with a concurrent control group andNULLotherwise.- seed
Random seed for probabilities computed by Monte Carlo simulation, or
NULLto use the current random number stream. If given, the previous state of the random number generator is restored on exit.
Value
An object of class c("qdm_boundary", "data.frame") with one
row per decision interval and the columns
- Conditions
n_t,n_candy_c(binary; onlyn_twithout a concurrent control group),n_tandsd_t(continuous),n_t,mean_t1andeffect1(two continuous endpoints; the observed treatment mean of endpoint 1 and its difference from the control) orexposure_t(time-to-event).- decision
The decision (a factor with levels
"Go","NoGo","Gray"and"Miss").- from, to
The ends of the interval of the observed quantity: the number of treatment responders or events (both ends included), or the observed treatment mean (of endpoint 2).
- rate_from, rate_to
Binary endpoint: the observed response rates \(y_t / n_t\) at the ends.
- surv_from, surv_to
Time-to-event endpoint evaluated by the milestone survival: the observed milestone survival probabilities \(\exp(-t_0 d_t / E_t)\) at the ends.
- effect_from, effect_to
The observed treatment effect at the ends: the observed rate, mean or milestone survival minus that of the concurrent control group, or minus the fixed control value or the mean (location) of the distribution of the control group; for the hazard ratio, the observed hazard \(d_t / E_t\) divided by the observed control hazard (
NAif the control group has no events), the fixed control hazard or the mean of the distribution of the control hazard. The values correspond tofromandto, soeffect_fromis larger thaneffect_towhen larger values of the observed quantity give smaller effects (for example, more events and the milestone survival).
The attributes design, axes, titles,
increasing, discrete and range record the design
and the information used by the print and plot methods.
Details
The observed quantity and the conditions depend on the endpoint:
- One binary endpoint
The number of responders of the treatment group \(y_t = 0, \ldots, n_t\). With a concurrent control group, one set of intervals for each number of control responders \(y_c = 0, \ldots, n_c\) (
n_tmust be a single number; \(n_c\) is that of the design). Without one, one set for each sample size inn_t, which shows how the boundary changes with the sample size.- One continuous endpoint
The observed treatment mean, for each combination of
sd_tandn_t(at most one of them may have more than one value). With a concurrent control group,data_cgives the observed control data. The boundary values are located by bisection between the values of a grid,mean_tor by default a grid of 201 values that covers the thresholds of the criterion.- Two continuous endpoints
The observed treatment mean of endpoint 2, located by bisection on the grid
mean_t[[2]], for each observed treatment mean of endpoint 1 inmean_t[[1]], with the sample covariance matrixcov_tandn_tsubjects (a single number). With a concurrent control group,data_cgives the observed control data.- One time-to-event endpoint
The number of events of the treatment group (
events_t), for each total observed time inexposure_t. With a concurrent control group,data_cgives the observed control data.
Two binary endpoints are not supported, because their decision depends on the four cell counts and cannot be summarized by one observed quantity.
The decision for each value is made as in qdm_decide. For an
observed mean, the first and last intervals extend to minus and plus
infinity; changes of the decision beyond the grid (whose ends are
extended by two values far beyond them) or two changes of the same
criterion between two neighboring grid values are not detected. With a
conjugate (Normal-Inverse-chi-squared) prior, the posterior scale
increases with the distance between the observed mean and the prior
mean, so the probability of the Go region need not increase with the
observed mean; the intervals then show where it decreases again.
Probabilities computed by Monte Carlo simulation (method = "MC",
or posterior predictive probabilities of a time-to-event endpoint) make
the boundary values approximate.
See also
Other operations:
qdm_calibrate(),
qdm_decide(),
qdm_oc()
Examples
# Single-arm study with a fixed control response rate of 0.2: responders
# needed out of 10 to 30 subjects
des <- design_binary(
n_t = 20, n_c = 0, prior_t = prior_beta(1, 1),
criterion = criterion_posterior(theta_tv = 0.2, theta_mav = 0.05,
gamma_go = 0.8, gamma_nogo = 0.8),
fixed_c = 0.2
)
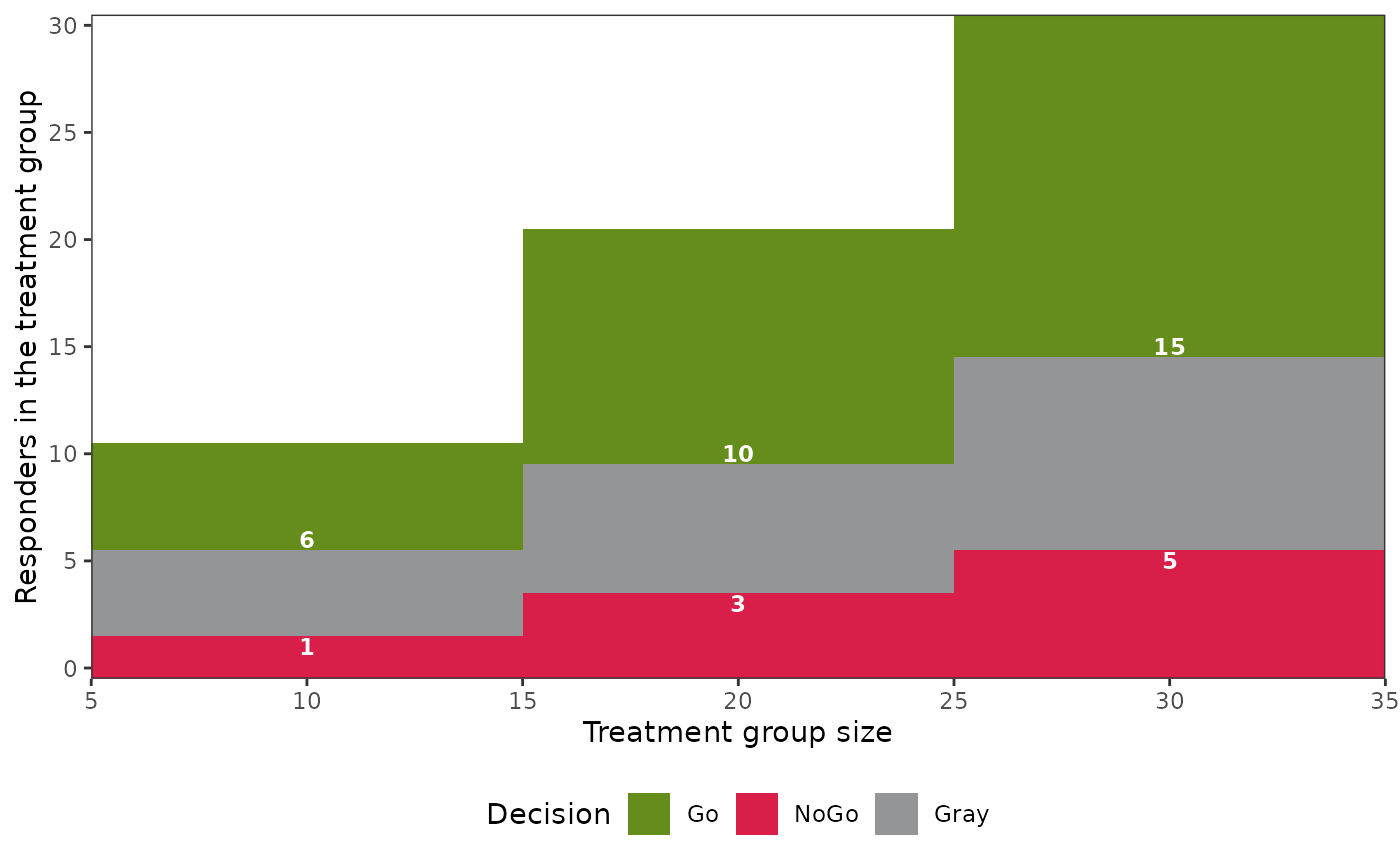
b <- qdm_boundary(des, n_t = c(10, 20, 30))
b
#> Decision boundary of a design with one binary endpoint
#>
#> Responders in the treatment group (y_t)
#> n_t NoGo Gray Go
#> 10 0-1 2-5 6-10
#> 20 0-3 4-9 10-20
#> 30 0-5 6-14 15-30
#>
#> Observed response rate (y_t / n_t)
#> n_t NoGo Gray Go
#> 10 0.0% to 10.0% 20.0% to 50.0% 60.0% to 100.0%
#> 20 0.0% to 15.0% 20.0% to 45.0% 50.0% to 100.0%
#> 30 0.0% to 16.7% 20.0% to 46.7% 50.0% to 100.0%
#>
#> Observed difference from the fixed control rate (y_t / n_t - 0.2)
#> n_t NoGo Gray Go
#> 10 -0.2 to -0.1 0 to 0.3 0.4 to 0.8
#> 20 -0.2 to -0.05 0 to 0.25 0.3 to 0.8
#> 30 -0.2 to -0.03333 0 to 0.2667 0.3 to 0.8
plot(b)
 # Continuous endpoint with a concurrent control group: observed
# differences in means needed for each observed standard deviation
des2 <- design_continuous(
n_t = 12, n_c = 12,
prior_t = prior_vague(), prior_c = prior_vague(),
criterion = criterion_posterior(theta_tv = 30, theta_mav = 15,
gamma_go = 0.6, gamma_nogo = 0.7),
method = "MM"
)
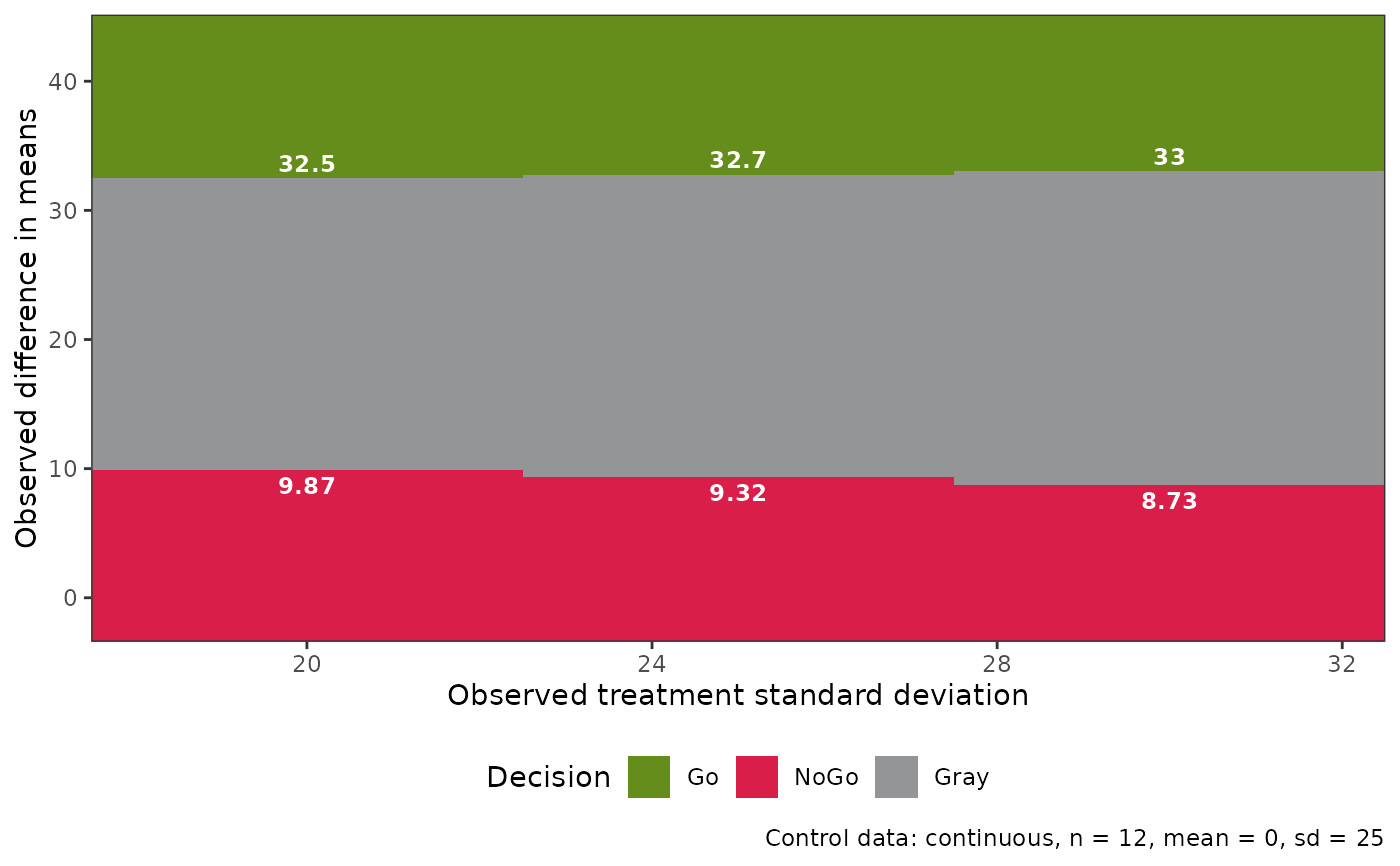
b2 <- qdm_boundary(des2, sd_t = c(20, 25, 30),
data_c = data_continuous(12, 0, 25))
b2
#> Decision boundary of a design with one continuous endpoint
#> n_t = 12
#> Control data: continuous, n = 12, mean = 0, sd = 25
#>
#> Observed treatment mean
#> sd_t NoGo Gray Go
#> 20 <= 9.866 9.866 to 32.47 >= 32.47
#> 25 <= 9.321 9.321 to 32.74 >= 32.74
#> 30 <= 8.735 8.735 to 33.02 >= 33.02
#>
#> Observed difference in means (control mean 0)
#> sd_t NoGo Gray Go
#> 20 <= 9.866 9.866 to 32.47 >= 32.47
#> 25 <= 9.321 9.321 to 32.74 >= 32.74
#> 30 <= 8.735 8.735 to 33.02 >= 33.02
plot(b2)