Computes the probabilities of Go, NoGo, Gray and Miss decisions of a design under scenarios for the true parameters.
Arguments
- design
A design created by
design_binary,design_continuous,design_binary2,design_continuous2ordesign_tte.- scenarios
A data frame with one row per scenario. For a binary endpoint the columns
pi_tandpi_cgive the true response rates of the treatment and control groups. For a continuous endpoint the columnsmu_t,sd_t,mu_candsd_cgive the true means and standard deviations. For two binary endpoints the columnspi_t1,pi_t2,rho_t,pi_c1,pi_c2andrho_cgive the true response rates of endpoints 1 and 2 (strictly between 0 and 1) and the correlation of the two endpoints in each group. For two continuous endpoints the columnsmu_t1,mu_t2,sd_t1,sd_t2,rho_t,mu_c1,mu_c2,sd_c1,sd_c2andrho_cgive the true means, standard deviations and correlation of the two endpoints in each group (the correlation strictly between -1 and 1). For a time-to-event endpoint the columnsmedian_tandmedian_cgive the true median survival times (positive). The columns of the control group are not needed for a design without a concurrent control group. Other columns, such as labels, are kept in the result.- nsim
Number of simulated studies per scenario for designs whose operating characteristics are computed by simulation.
- seed
Random seed for the simulation and for Monte Carlo estimates of probabilities, or
NULLto use the current random number stream. If given, the previous state of the random number generator is restored on exit.
Value
An object of class c("qdm_oc", "data.frame"): the scenarios
with the columns Go, NoGo, Gray and Miss
added. The attributes design and method record the design
and the method of computation.
Details
For a binary endpoint, all possible outcomes of the proof-of-concept study
are enumerated and the probabilities are exact (Kang et al., 2026, Section
4.3); nsim and seed are not used.
For a continuous endpoint, nsim studies are simulated under each
scenario. Only the sufficient statistics are simulated: the sample mean
\(\bar y = \mu + \sigma Z / \sqrt{n}\) and the sample standard deviation
\(s = \sigma \sqrt{X / (n - 1)}\), with \(Z \sim N(0, 1)\) and
\(X \sim \chi^2_{n - 1}\). The same random numbers are used for all
scenarios, so the results change smoothly across scenarios. The
probabilities have a simulation standard error of at most
\(0.5 / \sqrt{nsim}\) (0.005 for the default nsim). For each
simulated study, the probabilities of the Go and NoGo regions are computed
by the method of the design (see design_continuous), of which
method = "MM" is the fastest. To explore many scenarios or designs,
method = "MM" or a smaller nsim gives results quickly; the
chosen design can then be checked with method = "NI" and the
default nsim.
For two binary endpoints, all outcomes are enumerated (Yamaguchi et al.,
submitted, equation A.5) or nsim studies are simulated, as specified
by enumerate in design_binary2. The response rates
and correlation of each group are converted to cell probabilities by
cellprob_binary2; a scenario whose correlation is outside the
feasible range for its response rates is not evaluable, and its
probabilities are NA (with a warning).
For two continuous endpoints, nsim studies are simulated under each
scenario. Only the sufficient statistics are simulated: the sample means
\(\bar y = \mu + L z / \sqrt{n}\) and the matrix of sums of squares and
cross-products \(S = L A A^T L^T\), where \(L\) is the Cholesky
factor of the covariance matrix of the scenario, \(z\) has two
independent standard normal elements and \(A\) is the Bartlett factor
of a Wishart distribution with \(n - 1\) degrees of freedom. The same
random numbers are used for all scenarios.
For a time-to-event endpoint, nsim studies are simulated under each
scenario as specified by the conduct of the design (enrollment, dropout
and analysis time; see conduct_tte), with exponential event
times whose hazard is \(\log(2) / M\) for the median survival time
\(M\) of the scenario. The same random numbers are used for all
scenarios. With a predictive criterion, every simulated study needs
nMC simulated future studies (see design_tte), so
the computing time grows with nsim times nMC.
The decision for each outcome is made as in qdm_decide. A
warning is given when Miss decisions (both criteria met) have positive
probability in some scenario.
References
Kang, R., Yamaguchi, Y. and Han, C. (2026). Bayesian quantitative decision-making framework in cell and gene therapy development for rare diseases. Journal of Biopharmaceutical Statistics. doi:10.1080/10543406.2026.2655410
Yamaguchi, Y., Hu, H., Huang, Y., Han, C., Homma, G. and Wang, A. (submitted). Bivariate Bayesian quantitative decision-making for two endpoints in rare disease drug development.
See also
Other operations:
qdm_boundary(),
qdm_calibrate(),
qdm_decide()
Examples
des <- design_binary(
n_t = 12, n_c = 12,
prior_t = prior_beta(0.5, 0.5), prior_c = prior_beta(0.5, 0.5),
criterion = criterion_posterior(theta_tv = 0.2, theta_mav = 0.1,
gamma_go = 0.5, gamma_nogo = 0.8)
)
oc <- qdm_oc(des, data.frame(pi_t = seq(0.2, 0.8, by = 0.1), pi_c = 0.4))
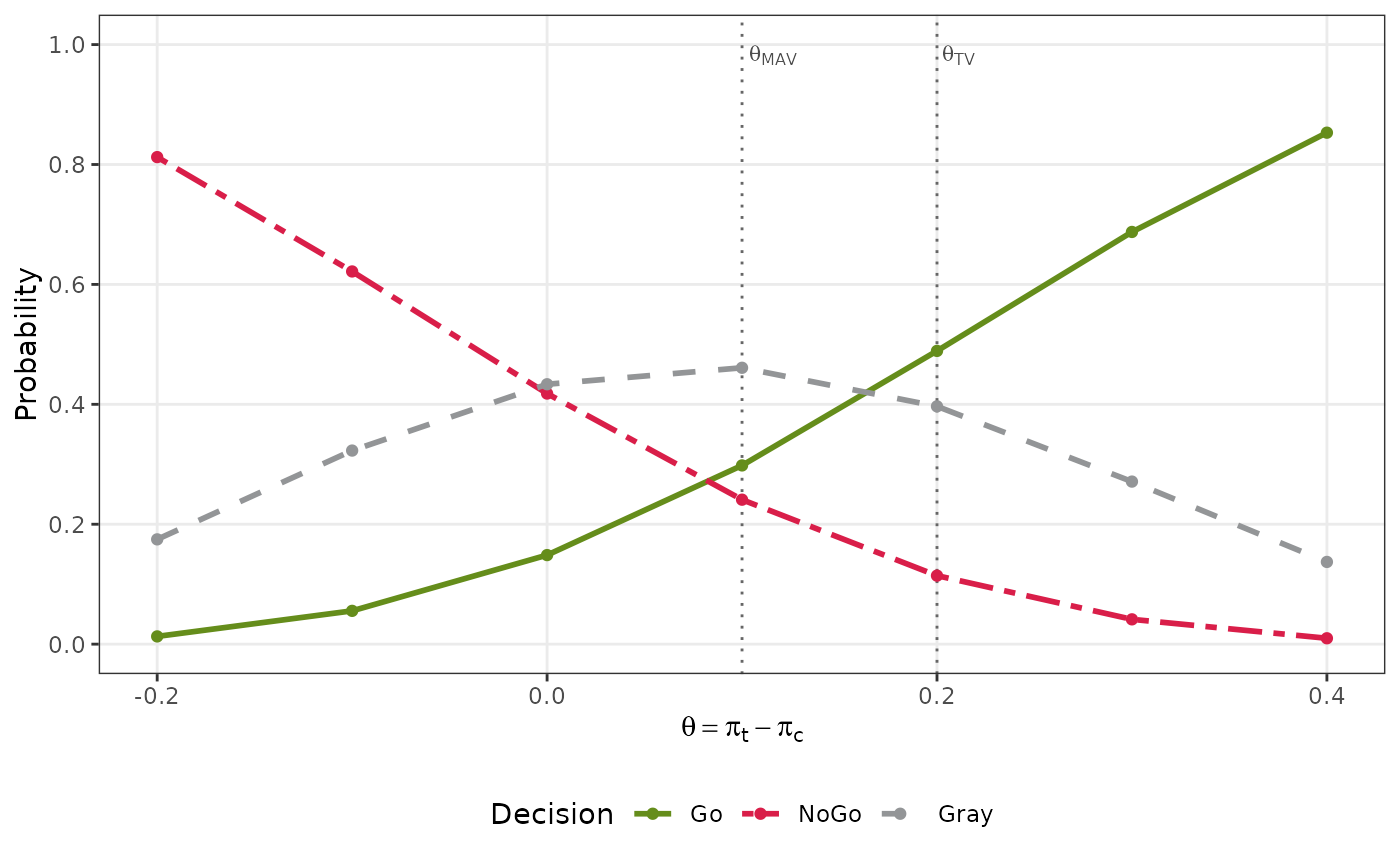
oc
#> Operating characteristics (exact enumeration of the outcomes)
#> pi_t pi_c Go NoGo Gray Miss
#> 0.2 0.4 0.01290 0.812335 0.1748 0
#> 0.3 0.4 0.05552 0.621598 0.3229 0
#> 0.4 0.4 0.14854 0.417981 0.4335 0
#> 0.5 0.4 0.29810 0.240949 0.4610 0
#> 0.6 0.4 0.48908 0.114276 0.3966 0
#> 0.7 0.4 0.68750 0.041368 0.2711 0
#> 0.8 0.4 0.85307 0.009801 0.1371 0
plot(oc)
 # Continuous endpoint (moment-matching approximation for speed)
des2 <- design_continuous(
n_t = 12, n_c = 12,
prior_t = prior_vague(), prior_c = prior_vague(),
criterion = criterion_posterior(theta_tv = 30, theta_mav = 15,
gamma_go = 0.6, gamma_nogo = 0.7),
method = "MM"
)
oc2 <- qdm_oc(des2, data.frame(mu_t = seq(0, 50, by = 10), sd_t = 25,
mu_c = 0, sd_c = 25),
nsim = 2000, seed = 1)
oc2
#> Operating characteristics (simulation of 2000 studies; probabilities by moment-matching approximation)
#> mu_t sd_t mu_c sd_c Go NoGo Gray Miss
#> 0 25 0 25 0.0010 0.8205 0.1785 0
#> 10 25 0 25 0.0165 0.4800 0.5035 0
#> 20 25 0 25 0.1130 0.1640 0.7230 0
#> 30 25 0 25 0.3915 0.0275 0.5810 0
#> 40 25 0 25 0.7530 0.0010 0.2460 0
#> 50 25 0 25 0.9450 0.0005 0.0545 0
# Two binary endpoints (small nMC for speed)
des3 <- design_binary2(
n_t = 6, n_c = 6,
prior_t = prior_dirichlet(rep(0.25, 4)),
prior_c = prior_dirichlet(rep(0.25, 4)),
criterion = criterion_posterior(theta_tv = c(0.15, 0.15),
theta_mav = c(0.10, 0.10),
gamma_go = 0.3, gamma_nogo = 0.4),
nMC = 2000
)
effects <- expand.grid(theta1 = c(0, 0.15, 0.3), theta2 = c(0, 0.15, 0.3))
oc3 <- qdm_oc(des3, data.frame(pi_t1 = 0.2 + effects$theta1,
pi_t2 = 0.2 + effects$theta2, rho_t = 0.3,
pi_c1 = 0.2, pi_c2 = 0.2, rho_c = 0.3),
seed = 1)
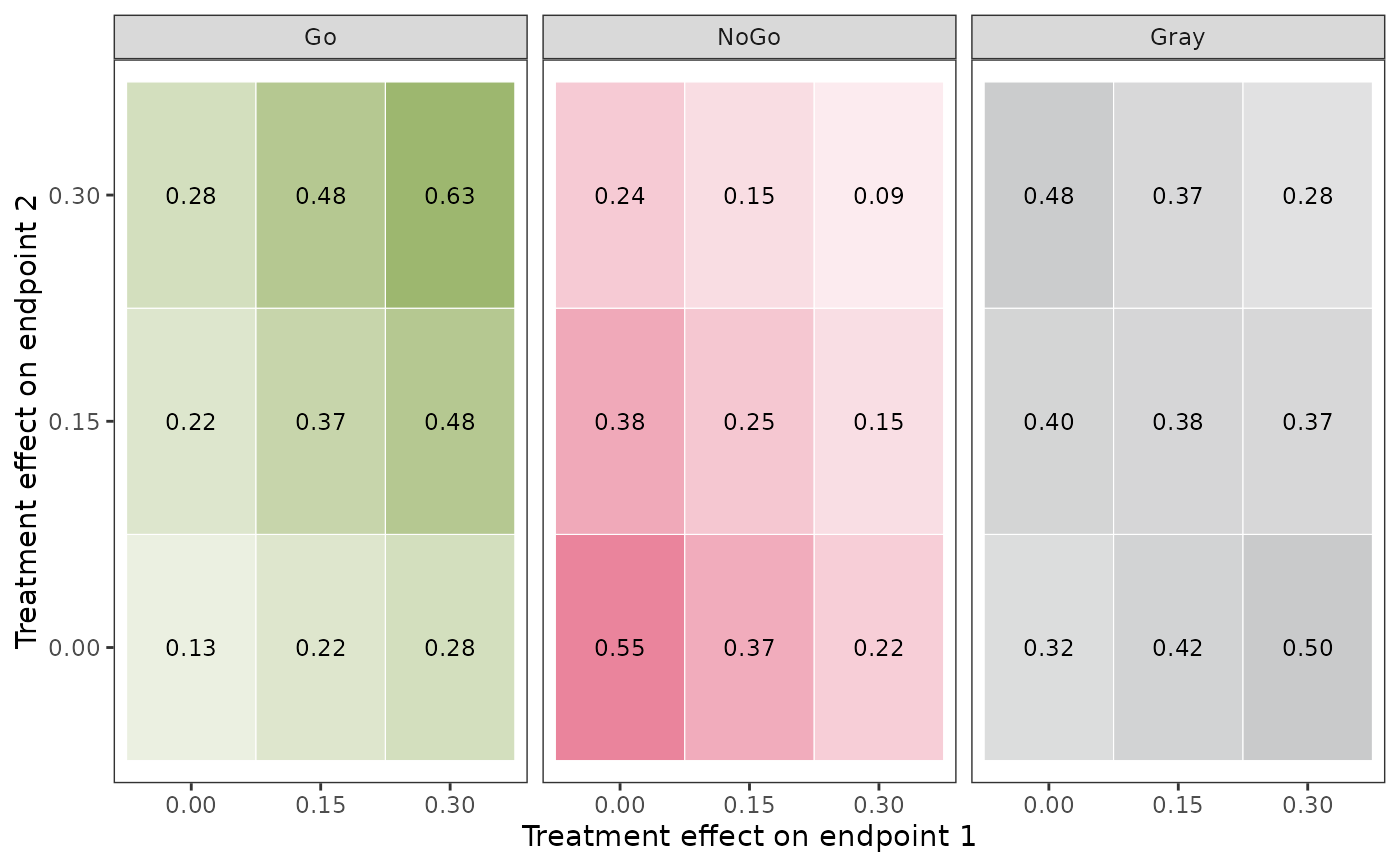
oc3
#> Operating characteristics (exact enumeration of the outcomes; posterior probabilities by Monte Carlo simulation (nMC = 2000))
#> pi_t1 pi_t2 rho_t pi_c1 pi_c2 rho_c Go NoGo Gray Miss
#> 0.20 0.20 0.3 0.2 0.2 0.3 0.1314 0.54527 0.3233 0
#> 0.35 0.20 0.3 0.2 0.2 0.3 0.2172 0.36700 0.4158 0
#> 0.50 0.20 0.3 0.2 0.2 0.3 0.2829 0.21711 0.5000 0
#> 0.20 0.35 0.3 0.2 0.2 0.3 0.2178 0.38223 0.4000 0
#> 0.35 0.35 0.3 0.2 0.2 0.3 0.3668 0.25104 0.3822 0
#> 0.50 0.35 0.3 0.2 0.2 0.3 0.4805 0.14661 0.3728 0
#> 0.20 0.50 0.3 0.2 0.2 0.3 0.2844 0.23534 0.4802 0
#> 0.35 0.50 0.3 0.2 0.2 0.3 0.4821 0.15235 0.3656 0
#> 0.50 0.50 0.3 0.2 0.2 0.3 0.6335 0.08806 0.2784 0
plot(oc3)